


Understanding Primavera P6 Through 50 Core Terminologies
1. Activity
Explanation: An activity is a task or set of tasks within a project that consumes time and resources.
Example: In a construction project, an activity could be “Pour Concrete” or “Install Windows.”
Location in Primavera P6: Found under the Activities section, where you can detail, schedule, and assign resources to each activity.
Usage: Activities are used to break down the project scope into manageable sections for scheduling and allocation of resources.
2. Baseline
Explanation: A baseline is a fixed project schedule used as a reference to measure project progress.
Example: The initial approved project schedule that all future performance is measured against.
Location in Primavera P6: Set up in the project details under the ‘Project’ menu.
Usage: Baselines help in tracking deviations in schedule and scope, essential for change management and progress reporting.
3. Critical Path
Explanation: The sequence of activities that determines the shortest possible duration to complete the project.
Example: In a software development project, activities like “Requirement Analysis,” “Coding,” and “Testing” may form the critical path.
Location in Primavera P6: Visible in the Gantt Chart view, often highlighted or distinguished from other paths.
Usage: Monitoring the critical path is vital to ensure the project is completed on time, making it crucial for schedule management.
4. WBS (Work Breakdown Structure)
Explanation: A hierarchical decomposition of the total project scope into deliverable-oriented segments.
Example: A project might be broken down into phases like “Design,” “Development,” and “Implementation.”
Location in Primavera P6: Found within the WBS section where you can structure and organize project deliverables.
Usage: WBS helps in organizing team responsibilities and aligning the deliverables with the project objectives.
5. Resource
Explanation: Resources are personnel, equipment, materials, or costs required to complete project activities.
Example: Engineers, computers, software licenses, and budget allocations are all resources.
Location in Primavera P6: Managed under the ‘Resources’ tab where you can define, assign, and track resources.
Usage: Effective resource management ensures that the project has all necessary inputs available when required without over- or under-utilization.
6. Gantt Chart
Explanation: A graphical representation of a project schedule that displays activities as bars along a timeline.
Example: Shows start and finish dates for all activities in a construction project.
Location in Primavera P6: Typically the main view used for project scheduling and tracking.
Usage: Gantt charts are essential for visualizing project progress and identifying relationships between activities.
7. Float (Slack)
Explanation: The amount of time an activity can be delayed without affecting the project’s completion date.
Example: An activity with a float of 5 days can be delayed by up to 5 days without delaying the overall project.
Location in Primavera P6: Calculated in the scheduling algorithms and displayed in the activity details.
Usage: Managing float helps in optimizing schedules and prioritizing tasks.
8. Predecessor
Explanation: An activity that must be completed before another activity can start.
Example: “Foundation must be laid” before “Walls can be erected.”
Location in Primavera P6: Defined in the activity relationships or dependencies section.
Usage: Critical for establishing project timelines and sequencing work.
9. Successor
Explanation: An activity that follows and depends on the completion of a predecessor activity.
Example: “Roof installation” follows “Wall construction.”
Location in Primavera P6: Set within the activities’ dependencies settings.
Usage: Successors help in planning subsequent stages of the project.
10. Calendar
Explanation: A scheduling tool that defines working and non-working days and times for project activities.
Example: Standard 5-day workweek or including custom calendars for shift work.
Location in Primavera P6: Set up under the ‘Enterprise’ menu where different calendars can be created and assigned.
Usage: Calendars are essential for accurate duration and resource availability calculations.
11. Milestone
Explanation: Milestones are significant points or events in a project that do not consume time but mark major achievements.
Example: Project kickoff, completion of a major phase, or client approvals.
Location in Primavera P6: Defined in the Activities section; can be set as start or finish milestones.
Usage: Milestones are crucial for tracking important achievements and decision points within the project timeline.
12. Lag
Explanation: A delay between successive activities, reflecting the time that must elapse between them.
Example: A 3-day lag between the completion of painting and the start of flooring installation to allow paint to dry.
Location in Primavera P6: Entered in the relationships among activities where dependencies are defined.
Usage: Lags help to realistically plan the necessary delays between tasks, accommodating real-world constraints.
13. Lead
Explanation: A situation where a successor activity can start before the predecessor has finished, overlapping in duration.
Example: Starting the installation of fixtures can overlap with the final phase of electrical wiring.
Location in Primavera P6: Configured within the activity relationships where tasks are linked.
Usage: Leads are used to compress the project schedule and optimize the timeline.
14. Duration
Explanation: The total amount of time required to complete an activity, regardless of the resources allocated.
Example: The construction of a wall might have a duration of 2 weeks.
Location in Primavera P6: Specified for each activity in the project schedule.
Usage: Duration is key to defining how long each task will take and impacts the overall project schedule.
15. Resource Leveling
Explanation: The process of adjusting the project schedule to resolve resource over-allocation or conflicts.
Example: Rescheduling tasks to ensure that an overbooked contractor has a manageable workload.
Location in Primavera P6: Can be applied through the resource management features, using automated tools to adjust schedules.
Usage: Resource leveling helps in efficiently utilizing resources without causing delays or overburdening resources.
16. Constraint
Explanation: Restrictions or conditions placed on the start or finish of an activity, affecting how it is scheduled.
Example: An activity must not start before a certain date due to legal or operational reasons.
Location in Primavera P6: Constraints can be set for individual activities under their properties.
Usage: Constraints are critical for adhering to external factors and requirements, influencing how the project timeline is constructed.
17. Baseline Schedule
Explanation: The approved project schedule at the start of the project, serving as a basis for tracking progress and changes.
Example: The original timeline agreed upon at the beginning of a project, before any work begins.
Location in Primavera P6: Stored in the project details and used as a reference throughout the project lifecycle.
Usage: The baseline schedule is essential for performance measurement and control, comparing current progress to original plans.
18. Actuals
Explanation: Real-time data reflecting the actual hours worked and costs incurred.
Example: Actual man-hours spent on a task or the actual cost of materials purchased.
Location in Primavera P6: Inputted into the activities as the project progresses to update the schedule with real data.
Usage: Tracking actuals is crucial for cost management and assessing productivity, helping to adjust forecasts and plans accurately.
19. Cost Account
Explanation: A method for tracking project expenses by categorizing them into specific accounts.
Example: Budget items like labor, materials, and equipment each assigned to different cost accounts.
Location in Primavera P6: Set up in the project’s cost management area, where budgets are allocated and tracked.
Usage: Cost accounts organize financial information, making it easier to monitor and control project expenditures.
20. Early Start (ES)
Explanation: The earliest possible time an activity can begin, based on the project network logic.
Example: If all prior necessary tasks are completed, an activity might have an early start date three weeks into the project.
Location in Primavera P6: Calculated automatically by the scheduling engine and displayed in the activity details.
Usage: Understanding the early start helps in optimizing the schedule and identifying potential accelerations in the project timeline.
21. Early Finish (EF)
Explanation: The earliest possible time an activity can finish based on the project network logic.
Example: If an activity starts on its Early Start date and proceeds without interruption, the Early Finish would be the earliest date it could be completed.
Location in Primavera P6: Calculated automatically by the software and visible in the activity details.
Usage: Knowing the Early Finish helps project managers to plan and anticipate the earliest possible project milestones.
22. Late Start (LS)
Explanation: The latest time an activity can start without delaying the project’s final completion date.
Example: If an activity must be completed by a certain date to not delay subsequent activities, the Late Start is the latest it can begin.
Location in Primavera P6: Calculated and displayed in the scheduling section of each activity.
Usage: Late Start dates are essential for adjusting schedules in response to delays or resource reallocation.
23. Late Finish (LF)
Explanation: The latest possible time an activity can finish without extending the project’s end date.
Example: If an activity is dependent on another activity that can finish late without project delay, this defines its Late Finish.
Location in Primavera P6: Automatically determined by the scheduling engine and shown within the activity’s timeline.
Usage: Late Finish dates help in identifying the buffer times and flexibility within the project schedule.
24. Total Float
Explanation: The amount of time that an activity can be delayed without affecting the planned project completion date.
Example: An activity with a Total Float of 5 days can be delayed for up to 5 days without impacting the overall project timeline.
Location in Primavera P6: Calculated for each activity and visible in the scheduling details.
Usage: Managing Total Float is critical for prioritizing tasks and allocating resources efficiently.
25. Free Float
Explanation: The amount of time an activity can be delayed without affecting the start date of any immediately following activities.
Example: If an activity can be postponed without delaying the subsequent activity, it has Free Float.
Location in Primavera P6: Displayed in the activity details section after schedule calculations.
Usage: Free Float is useful for project managers when reassessing resource allocation and handling delays.
26. Percent Complete
Explanation: A measure of the progress of an activity, expressed as a percentage of the work completed.
Example: If half of an activity’s scope is finished, it would be reported as 50% complete.
Location in Primavera P6: Updated manually or calculated based on actual work data in the project tracking section.
Usage: Percent Complete is vital for tracking progress, updating stakeholders, and recalibrating timelines and resources.
27. Progress Line
Explanation: A visual indicator on the Gantt chart that shows the actual progress against the planned schedule.
Example: A line across the schedule bars that indicates the current status of project activities as per the timeline.
Location in Primavera P6: Displayed on the Gantt chart view, overlaying the activity bars.
Usage: Progress lines are crucial for at-a-glance assessment of project performance and identifying delays or advances in schedule.
28. Project ID
Explanation: A unique identifier assigned to a project within Primavera P6 for tracking and management purposes.
Example: Each project might be assigned a code like “PRJ2023-001” to differentiate it in a portfolio.
Location in Primavera P6: Assigned during the project creation phase and used as a reference in reports and documentation.
Usage: Project IDs help in organizing and accessing project data efficiently, especially in environments managing multiple projects.
29. Activity Code
Explanation: A customizable code assigned to activities to categorize them for filtering, sorting, and reporting.
Example: Codes like “Design”, “Construction”, and “Testing” could be used to classify project activities.
Location in Primavera P6: Set in the activity settings, these codes help manage large data sets and complex schedules.
Usage: Activity Codes are used to streamline the management and viewing of activities, especially in large projects.
30. Activity ID
Explanation: A unique identifier assigned to each activity within a project in Primavera P6.
Example: Each task might have a specific ID like “ACT-1001” to distinguish it within the project.
Location in Primavera P6: Generated when activities are created and used throughout the project lifecycle for tracking.
Usage: Activity IDs are crucial for referencing specific tasks during planning, execution, and reporting phases.
31. Network Logic
Explanation: The set of dependencies and relationships between activities within a project schedule.
Example: Activities such as “Start Foundation Work” must precede “Begin Framing,” establishing a sequence in project tasks.
Location in Primavera P6: Configured in the relationships section of each activity, where predecessors and successors are defined.
Usage: Network logic is critical for building effective and efficient project schedules, ensuring tasks are performed in the correct order.
32. Node
Explanation: A point in a network diagram that represents the start or finish of an activity.
Example: In a network diagram, nodes could represent significant milestones like “Project Start” or “Phase Completion.”
Location in Primavera P6: Visible in network diagram views which can be accessed from the project layout options.
Usage: Nodes help in visualizing the flow of activities and understanding the project structure at a glance.
33. Schedule Compression
Explanation: Techniques applied to shorten the project schedule without altering the project scope, typically by increasing resources or changing sequencing.
Example: Applying crashing or fast tracking to reduce the timeline for deliverables without compromising project quality.
Location in Primavera P6: Managed through adjustments in activity durations, relationships, and resource allocations.
Usage: Schedule compression is often used when project deadlines are adjusted or to recover time lost to delays.
34. Critical Path Method (CPM)
Explanation: A scheduling technique used to determine the longest path of planned activities to the end of the project, and the shortest time possible to complete the project.
Example: Identifying the sequence of dependent tasks that cannot be delayed without affecting the project completion date.
Location in Primavera P6: Calculated automatically and displayed in the Gantt chart and network diagram views.
Usage: Understanding the critical path is essential for managing deadlines and prioritizing resources and tasks.
35. PERT (Program Evaluation and Review Technique)
Explanation: A statistical tool used to analyze and estimate the duration of project tasks considering uncertainty and risk.
Example: Estimating the optimistic, pessimistic, and most likely times for complex activities to create a more realistic schedule.
Location in Primavera P6: Utilized in the planning phase to create schedules that accommodate uncertainty.
Usage: PERT is particularly useful in projects where time estimation is difficult due to variability in task performance.
36. Resource Allocation
Explanation: The process of assigning available resources to tasks throughout the project lifecycle.
Example: Allocating manpower, equipment, and materials to specific tasks based on the project schedule and resource availability.
Location in Primavera P6: Managed within the resources section where each resource can be assigned to multiple activities.
Usage: Proper resource allocation is crucial for maintaining project efficiency and preventing bottlenecks.
37. Histogram
Explanation: A graphical representation of resource usage over time, helping in understanding the distribution and requirements of resources.
Example: A histogram showing the number of workers needed each week throughout the duration of the project.
Location in Primavera P6: Can be viewed in the resource analysis section, providing visual feedback on resource allocation and utilization.
Usage: Histograms are important for planning and optimizing resource management, ensuring that resources are not over- or under-utilized.
38. Timescale
Explanation: The representation of time units on project charts, such as days, weeks, or months.
Example: Setting the timescale to weeks on a Gantt chart to provide a more general overview of project progress.
Location in Primavera P6: Adjustable in the view settings of various charts and diagrams to suit different levels of project detail.
Usage: Choosing the right timescale is essential for effective communication and understanding of project timelines.
39. Work Package
Explanation: The lowest level of the work breakdown structure, representing tasks that are grouped into a manageable set.
Example: A work package in a construction project might include all tasks related to HVAC installation.
Location in Primavera P6: Defined within the WBS hierarchy, where each work package is detailed with specific tasks and responsibilities.
Usage: Work packages are critical for detailed planning and delegation of work, allowing for precise control and monitoring.
40. Threshold
Explanation: A predetermined value that triggers an action or a response when reached, often used in performance management.
Example: Setting a cost threshold that, when exceeded, requires a review and possibly corrective actions.
Location in Primavera P6: Configured in the project controls or monitoring sections, where alerts can be set based on these thresholds.
Usage: Thresholds are useful for proactive project management, enabling timely decisions based on performance metrics.
41. Variance
Explanation: The difference between the planned and actual performance, such as in terms of schedule, cost, or scope.
Example: If a task was budgeted to cost $10,000 but actually cost $12,000, there is a $2,000 cost variance.
Location in Primavera P6: Analyzed in the tracking or variance analysis sections, where discrepancies between planned and actual figures are highlighted.
Usage: Variance analysis is critical for project control, allowing managers to identify issues early and take corrective actions.
42. Weighting
Explanation: Assigning relative importance or priority to different project tasks or objectives, often used in evaluation and decision-making processes.
Example: Higher weighting might be given to critical path activities to prioritize resources and monitoring.
Location in Primavera P6: Applied in the planning stages, particularly in resource allocation and schedule optimization.
Usage: Weighting helps in focusing efforts and resources on the most impactful areas of the project, enhancing efficiency and effectiveness.
43. Update
Explanation: The process of revising project data to reflect the most current information, including progress and changes.
Example: Updating the project schedule weekly to include completed activities and revising the dates for upcoming tasks based on current progress.
Location in Primavera P6: Carried out in the project execution phase, where all changes and progress are recorded.
Usage: Regular updates are essential for maintaining accurate and relevant project data, facilitating effective management and decision-making.
44. Baseline Start/Finish
Explanation: The planned start and finish dates for an activity as established in the baseline schedule.
Example: If the baseline start date for an activity was set for June 1st and the baseline finish for June 15th, these dates serve as references for performance evaluation.
Location in Primavera P6: Defined when creating the baseline of the project, these dates are critical for tracking and comparison against actual dates.
Usage: Baseline start and finish dates are used to measure schedule performance and identify deviations.
45. Bar Chart
Explanation: A form of graphical representation in project management that uses bars to depict the timing and duration of project tasks.
Example: A bar chart or Gantt chart shows each task’s duration on a horizontal timeline, allowing for easy visualization of the project schedule.
Location in Primavera P6: Primarily viewed in the Gantt chart section, where activities are mapped out over time.
Usage: Bar charts are essential for planning, monitoring, and communicating project schedules.
46. Enterprise Project Structure (EPS)
Explanation: A hierarchical framework that organizes all projects within an organization under various levels of categorization.
Example: An organization might have an EPS that includes categories like “Research and Development,” “Construction Projects,” and “IT Initiatives.”
Location in Primavera P6: Set up in the enterprise data settings, where it structures the portfolio of projects.
Usage: EPS is critical for managing and reporting on a portfolio of projects, facilitating strategic alignment and resource sharing.
47. OBS (Organizational Breakdown Structure)
Explanation: A depiction of an organization’s hierarchy used to manage and control projects by assigning responsibilities.
Example: An OBS might categorize project responsibilities by departments such as Engineering, Procurement, and Construction.
Location in Primavera P6: Configured in the project’s organizational settings, aligning projects with internal management structures.
Usage: OBS helps in structuring project governance and ensuring accountability across different organizational units.
48. Global Change
Explanation: A feature in Primavera P6 that allows for broad modifications to be applied across multiple project elements simultaneously.
Example: Adjusting all task durations by an increase of 10% due to a change in project scope.
Location in Primavera P6: Accessed through the tools or administration menus, where changes can be set and applied globally.
Usage: Global changes facilitate efficient project updates, especially in large-scale projects or where repetitive changes are required.
49. Dashboard
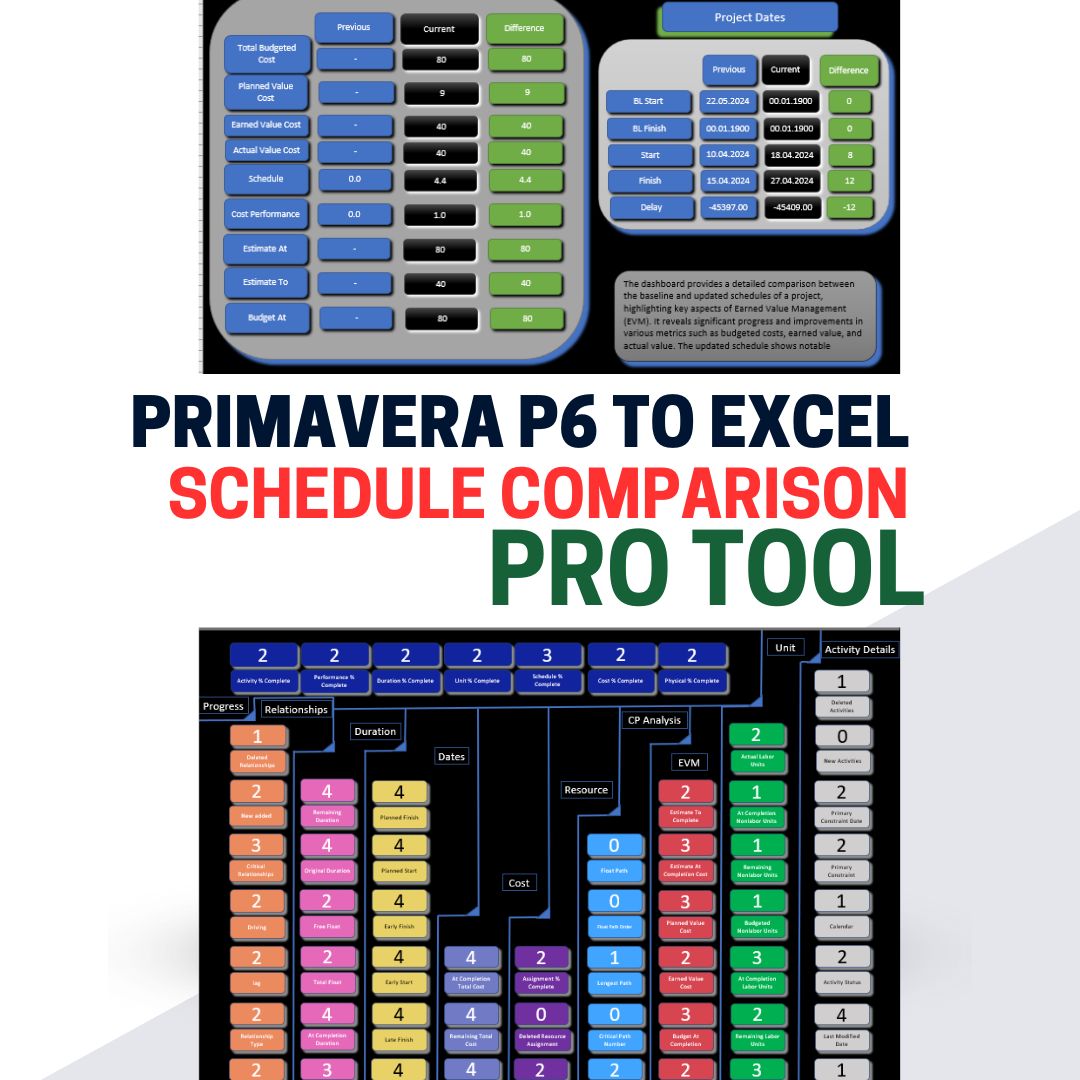
Explanation: A visual display of key project metrics and statuses, providing a quick overview of project health and progress.
Example: A dashboard may display current vs. baseline schedule performance, cost overruns, and resource allocation statuses.
Location in Primavera P6: Configured in the reporting or project monitoring sections, where various widgets and indicators can be customized.
Usage: Dashboards are essential for executives and project managers to obtain real-time insights into project performance.
50. S-Curve
Explanation: A graphical representation of cumulative project variables such as costs or work hours, plotted over time, showing the rate of progress.
Example: An S-Curve might show the cumulative percentage of the project budget spent over time, helping to understand spending patterns.
Location in Primavera P6: Typically found in the project’s reporting or analysis sections, where it helps visualize financial or resource metrics over the project lifecycle.
Usage: S-curves are vital for tracking and forecasting project performance, offering a visual representation of growth and trends.
| No. | Term | Explanation | Example | Location in Primavera P6 | Usage |
| 1 | Activity | A task or set of tasks in a project that consumes time and resources. | Installing software | Activities section | Used to define and manage work within a project. |
| 2 | Baseline | A fixed project schedule that serves as a benchmark for progress. | The original approved project schedule | Project details under ‘Project’ menu | Helps track deviations in schedule and scope. |
| 3 | Critical Path | The sequence of activities that determines the earliest possible completion date of the project. | Activities from foundation laying to final inspection | Gantt Chart view | Essential for managing project duration and ensuring on-time completion. |
| 4 | WBS | A hierarchical decomposition of the total scope of work. | Breakdown from project phase to individual tasks | WBS section | Organizes project deliverables into manageable components. |
| 5 | Resource | Personnel, equipment, materials, or costs required to complete activities. | Engineers, concrete, budget | Resources tab | Manages input requirements for activities. |
| 6 | Gantt Chart | A graphical representation of a project schedule, showing activities as horizontal bars. | Chart showing project phases over time | Main view for scheduling | Visualizes project timeline and dependencies. |
| 7 | Float (Slack) | The amount of time an activity can be delayed without delaying the project completion date. | 5 days of allowable delay without impact | Activity details | Optimizes schedule flexibility and task prioritization. |
| 8 | Predecessor | An activity that must be completed before a dependent activity can start. | Foundation must be completed before wall construction | Activity relationships settings | Defines sequence and dependencies of tasks. |
| 9 | Successor | An activity that depends on the completion of a predecessor activity. | Wall construction follows foundation completion | Dependencies settings | Helps in planning subsequent stages of the project. |
| 10 | Calendar | A scheduling tool that defines working and non-working days/times. | Standard 5-day workweek | Under ‘Enterprise’ menu | Ensures accurate duration and resource availability calculations. |
| 11 | Milestone | A significant event or point in a project timeline. | Project kickoff, phase completion | Activities section as start or finish milestone | Marks major achievements and decision points. |
| 12 | Lag | A delay between successive activities, reflecting the time that must elapse between them. | 3-day drying period after painting | Relationships among activities | Plans for necessary delays between tasks. |
| 13 | Lead | A situation where a successor activity can start before the predecessor has finished, overlapping in duration. | Overlapping design and initial construction phases | Activity relationships | Shortens the project schedule by overlapping tasks. |
| 14 | Duration | The total amount of time required to complete an activity, regardless of the resources allocated. | 2 weeks to construct a wall | Each activity in the project schedule | Key in defining how long tasks will take. |
| 15 | Resource Leveling | The process of adjusting the project schedule to resolve resource over-allocation or conflicts. | Adjusting tasks to manage an overbooked contractor | Resource management features | Ensures resources are used efficiently without overburdening. |
| 16 | Constraint | Restrictions or conditions placed on the start or finish of an activity, affecting how it is scheduled. | Task must start after a certain permit is received | Individual activities under their properties | Manages external dependencies and requirements. |
| 17 | Baseline Schedule | The approved project schedule at the start of the project, serving as a basis for tracking progress and changes. | Original project timeline before any work begins | Stored in project details | Measures project performance against original plans. |
| 18 | Actuals | Real-time data reflecting the actual hours worked and costs incurred. | Actual hours spent on tasks, actual material costs | Activities update section | Used for cost management and productivity assessment. |
| 19 | Cost Account | A method for tracking project expenses by categorizing them into specific accounts. | Labor, materials, equipment categories | Project’s cost management area | Organizes financial tracking and controls expenditures. |
| 20 | Early Start (ES) | The earliest possible time an activity can begin, based on the project network logic. | Activity can start three weeks into the project | Scheduling engine | Optimizes the schedule by identifying potential early starts. |
| 21 | Early Finish (EF) | The earliest possible time an activity can finish based on the project network logic. | Earliest completion date without interruptions | Activity details | Helps plan and anticipate project milestones. |
| 22 | Late Start (LS) | The latest time an activity can start without delaying the project’s final completion date. | Latest start date to avoid project delay | Scheduling section of each activity | Adjusts schedules in response to delays or resource reallocation. |
| 23 | Late Finish (LF) | The latest possible time an activity can finish without extending the project’s end date. | Latest finish date without affecting overall timeline | Automatically determined by the scheduling engine | Identifies buffer times within the project schedule. |
| 24 | Total Float | The amount of time that an activity can be delayed without affecting the planned project completion date. | 5 days of delay without impacting the project end date | Scheduling details | Manages task prioritization and resource allocation. |
| 25 | Free Float | The amount of time an activity can be delayed without affecting the start date of any immediately following activities. | 2 days delay without affecting next task | Activity details section | Assesses schedule flexibility for individual tasks. |
| 26 | Percent Complete | A measure of the progress of an activity, expressed as a percentage of the work completed. | 50% of the task completed | Project tracking section | Tracks progress, updates stakeholders, and recalibrates plans. |
| 27 | Progress Line | A visual indicator on the Gantt chart that shows the actual progress against the planned schedule. | Line indicating current status versus planned timeline | Gantt chart overlaying activity bars | Provides a quick visual assessment of project performance. |
| 28 | Project ID | A unique identifier assigned to a project within Primavera P6 for tracking and management purposes. | Code like “PRJ2023-001” | Project creation phase | Organizes and accesses project data efficiently. |
| 29 | Activity Code | A customizable code assigned to activities to categorize them for filtering, sorting, and reporting. | Codes like “Design”, “Construction” | Activity settings | Manages and views activities, especially in large projects. |
| 30 | Activity ID | A unique identifier assigned to each activity within a project in Primavera P6. | Specific ID like “ACT-1001” | Generated when activities are created | References specific tasks during planning and execution. |
| 31 | Network Logic | The set of dependencies and relationships between activities within a project schedule. | Sequence from foundation work to final inspection | Relationships section of activities | Builds effective project schedules. |
| 32 | Node | A point in a network diagram that represents the start or finish of an activity. | Milestones like “Project Start” or “Phase Completion” | Network diagram views | Visualizes the flow and structure of project activities. |
| 33 | Schedule Compression | Techniques applied to shorten the project schedule without altering the project scope, typically by increasing resources or changing sequencing. | Crashing or fast tracking to meet adjusted deadlines | Adjustments in activity durations and relationships | Recovers time lost to delays or meets adjusted deadlines. |
| 34 | Critical Path Method (CPM) | A scheduling technique used to determine the longest path of planned activities to the end of the project, and the shortest time possible to complete the project. | Sequence of dependent tasks critical for project completion | Automatically calculated and displayed in views | Manages project deadlines and prioritizes resources. |
| 35 | PERT | A statistical tool used to analyze and estimate the duration of project tasks considering uncertainty and risk. | Estimating times for complex activities | Planning phase to accommodate task variability | Handles time estimation variability in projects. |
| 36 | Resource Allocation | The process of assigning available resources to tasks throughout the project lifecycle. | Manpower and equipment assigned to specific tasks | Resources section where resources are managed | Maintains project efficiency and prevents resource bottlenecks. |
| 37 | Histogram | A graphical representation of resource usage over time, helping in understanding the distribution and requirements of resources. | Chart of weekly worker requirements | Resource analysis section | Plans and optimizes resource management. |
| 38 | Timescale | The representation of time units on project charts, such as days, weeks, or months. | Setting the Gantt chart to display weeks | View settings of various charts and diagrams | Communicates project timelines effectively. |
| 39 | Work Package | The lowest level of the work breakdown structure, representing tasks that are grouped into a manageable set. | HVAC installation tasks | WBS hierarchy | Facilitates detailed planning and control of project tasks. |
| 40 | Threshold | A predetermined value that triggers an action or a response when reached, often used in performance management. | Cost threshold requiring review | Project controls or monitoring sections | Enables proactive management based on performance metrics. |
| 41 | Variance | The difference between the planned and actual performance, such as in terms of schedule, cost, or scope. | $2,000 cost variance | Tracking or variance analysis sections | Identifies issues and enables corrective actions. |
| 42 | Weighting | Assigning relative importance or priority to different project tasks or objectives, often used in evaluation and decision-making processes. | Prioritizing critical path activities | Planning stages for resource allocation | Focuses efforts on impactful project areas. |
| 43 | Update | The process of revising project data to reflect the most current information, including progress and changes. | Weekly updates of completed activities | Project execution phase | Maintains project data accuracy and relevance. |
| 44 | Baseline Start/Finish | The planned start and finish dates for an activity as established in the baseline schedule. | June 1st start, June 15th finish as baseline dates | Creating the baseline | Measures schedule adherence and identifies deviations. |
| 45 | Bar Chart | A form of graphical representation in project management that uses bars to depict the timing and duration of project tasks. | Visual timeline of project tasks | Gantt chart section | Plans and monitors project schedules. |
| 46 | EPS | A hierarchical framework that organizes all projects within an organization under various levels of categorization. | Categories like “Construction Projects” | Enterprise data settings | Manages a portfolio of projects for strategic alignment and resource sharing. |
| 47 | OBS | A depiction of an organization’s hierarchy used to manage and control projects by assigning responsibilities. | Categorization by departments like Engineering | Project’s organizational settings | Structures project governance and ensures accountability. |
| 48 | Global Change | A feature in Primavera P6 that allows for broad modifications to be applied across multiple project elements simultaneously. | Adjusting all task durations by 10% | Tools or administration menus | Facilitates efficient project updates and changes. |
| 49 | Dashboard | A visual display of key project metrics and statuses, providing a quick overview of project health and progress. | Displays of schedule performance, cost overruns | Reporting or project monitoring sections | Offers real-time insights into project performance for executives and managers. |
| 50 | S-Curve | A graphical representation of cumulative project variables such as costs or work hours, plotted over time, showing the rate of progress. | Chart of budget spent over time | Project’s reporting or analysis sections | Tracks and forecasts project performance, visualizing growth and trends. |
Leave a Reply
You must be logged in to post a comment.