Introduction
We will learn about creating an S-curve or histogram in Primavera and Excel. In this Article, we will export data into Excel and create an S-curve there. However, the question is: can we create an S-curve or histogram without available resources? The answer is no. You need some value to create an S-curve or histogram. So, how can you get that value if you don’t have available hours in your project?
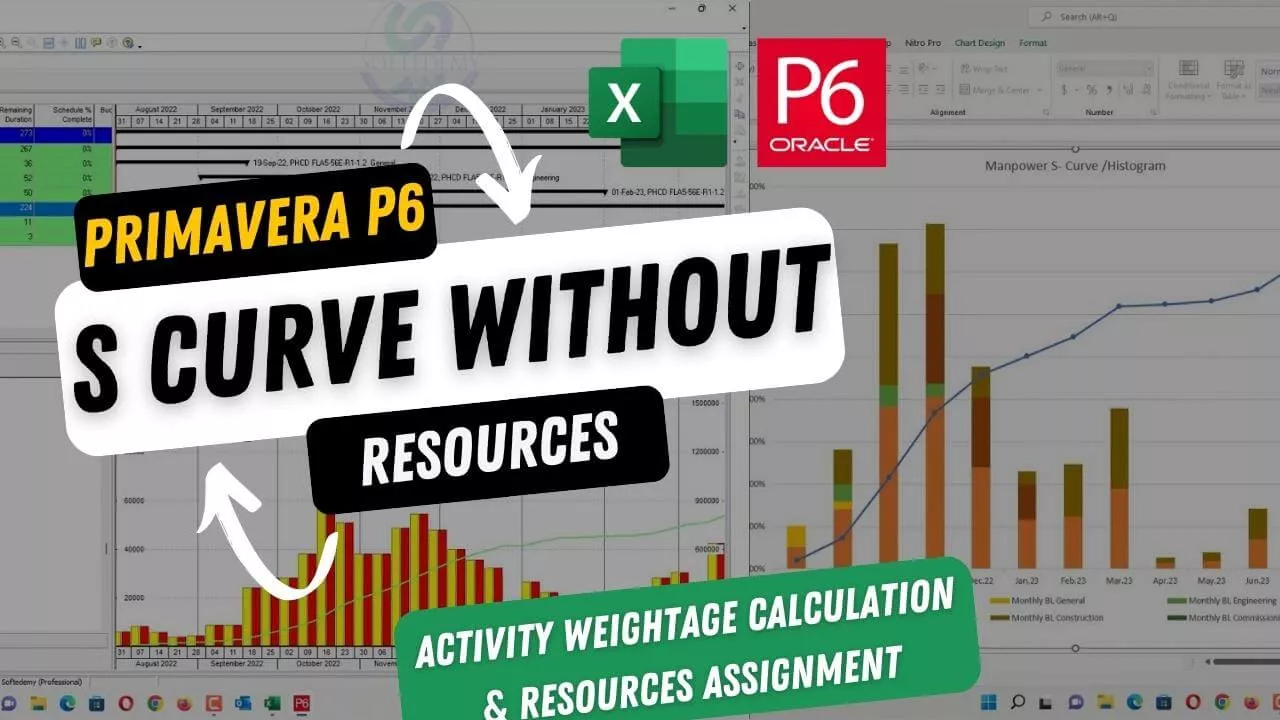
First, let’s discuss creating an S-curve on the basis of duration. It is wrong to create any S-curve on the basis of duration because the duration lies on the x-axis. The timeline in the bottom is the x-axis, and on the y-axis, you need some value, such as percent, unit, or cost. If you don’t have any cost or unit, you cannot create an S-curve.
In this Article, we will tell you how to create an S-curve without any resources, cost, or unit. We will use a project that we have already created and do not want to lose our hours and material or cost resources. We will copy and paste the project with the same name to get the same data.
The project we will use has 273 days, and we don’t know anything about any hours. We have created a sheet for those who don’t know about weightages. Weightages are different for different projects. You need to sit with the technical team and decide how much percent is there for each milestone or each state. We have set 3.5 percent for General, 6 percent for Engineering, 23.63.5 percent for Procurement, and 4 percent for Construction. You can change the value according to your project.
We have also created estimated labor units. We have taken 30 of its labor, and mostly, there is 18 to 25 to 30 percent labor cost of the project. We have taken $3.5 per hour of labor and created labor hours. It is 1.1 million man-hours here. You can change it according to your area.
Step by Step Guide to Create S-Curve Without Resources in Primavera P6 using Activity Weightage Calculation
Now that we have created our sheet let’s move to creating the S-curve. You can follow the step-by-step guide given below:
Open Primavera P6 and create a project.
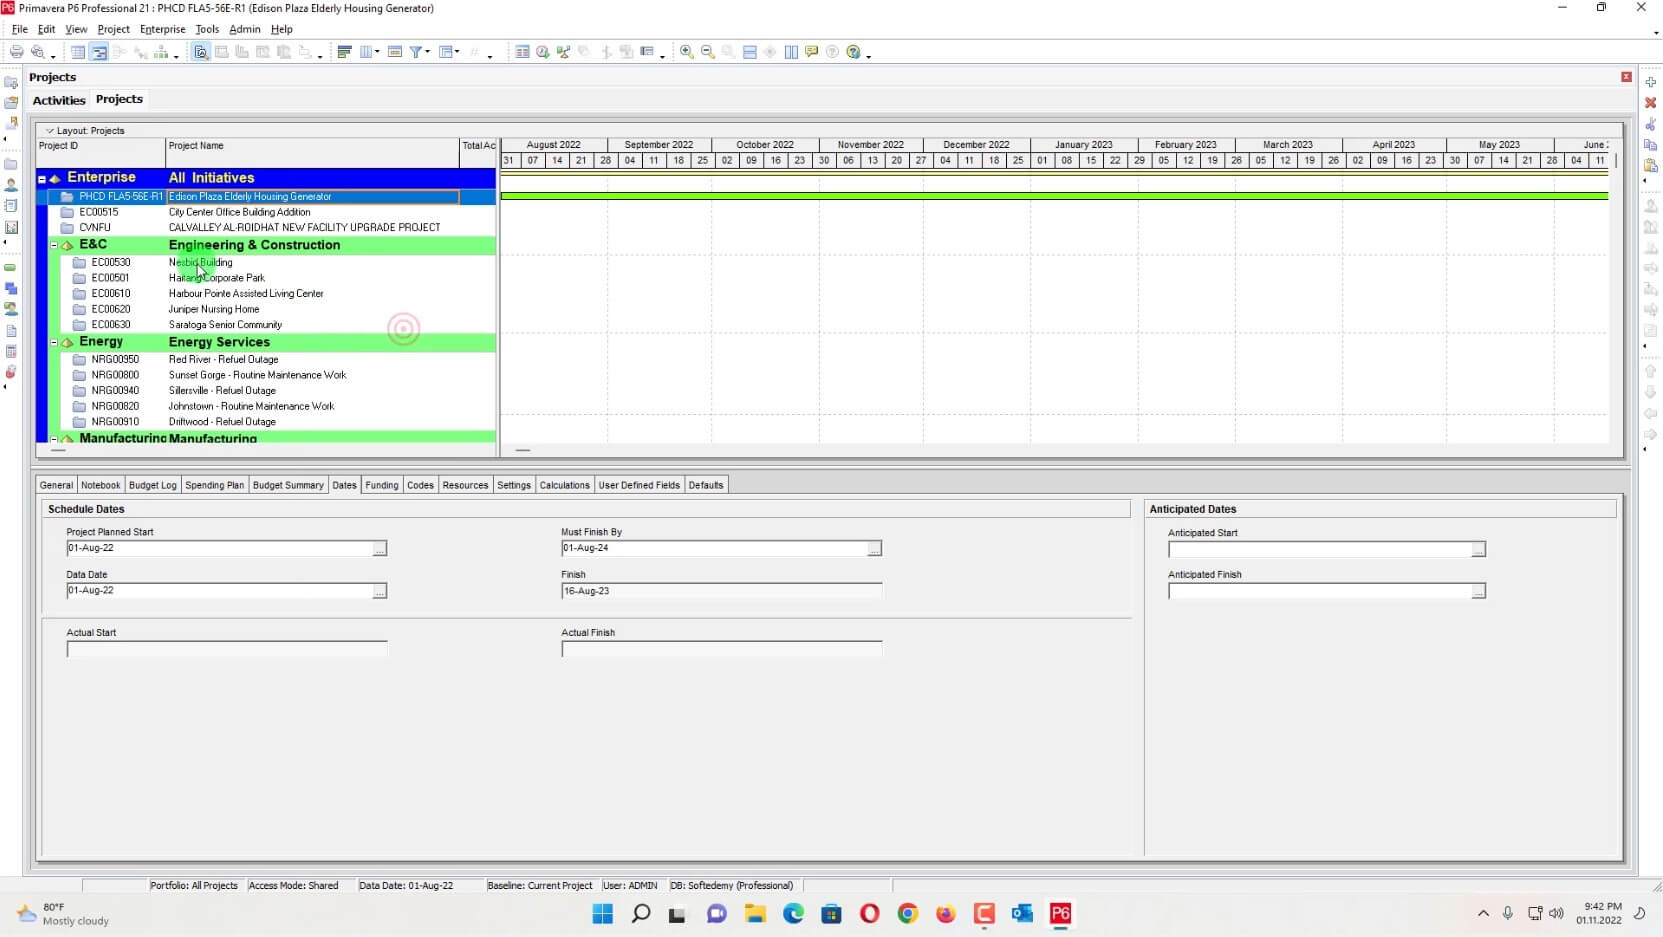
Add activities and assign resources to them.
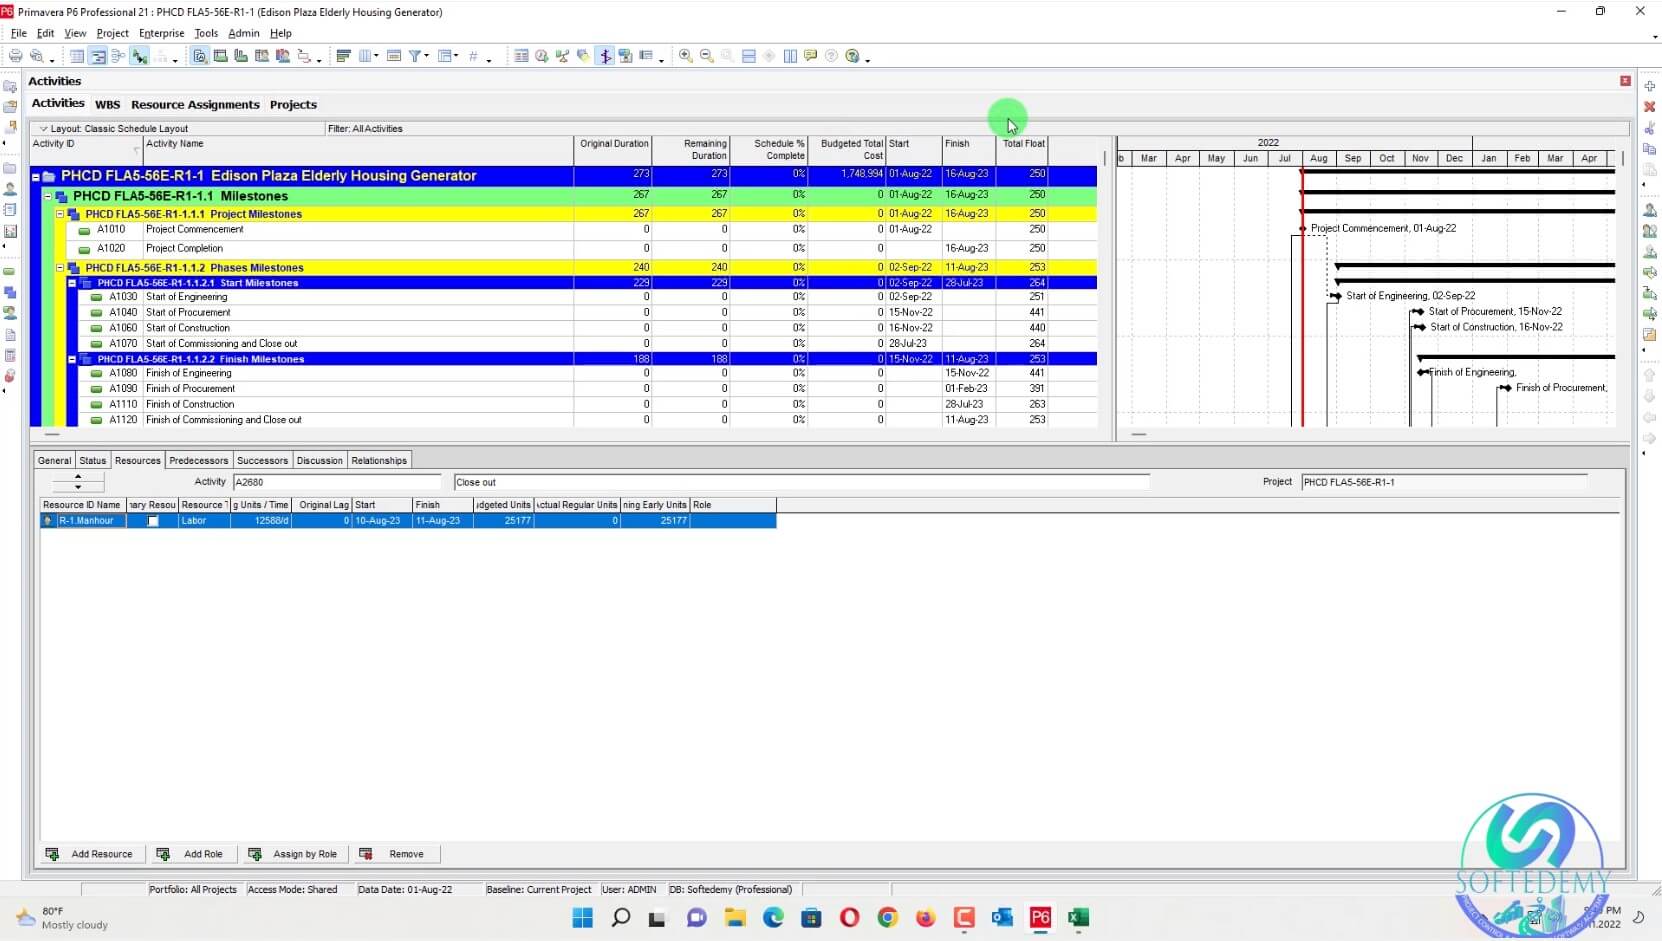
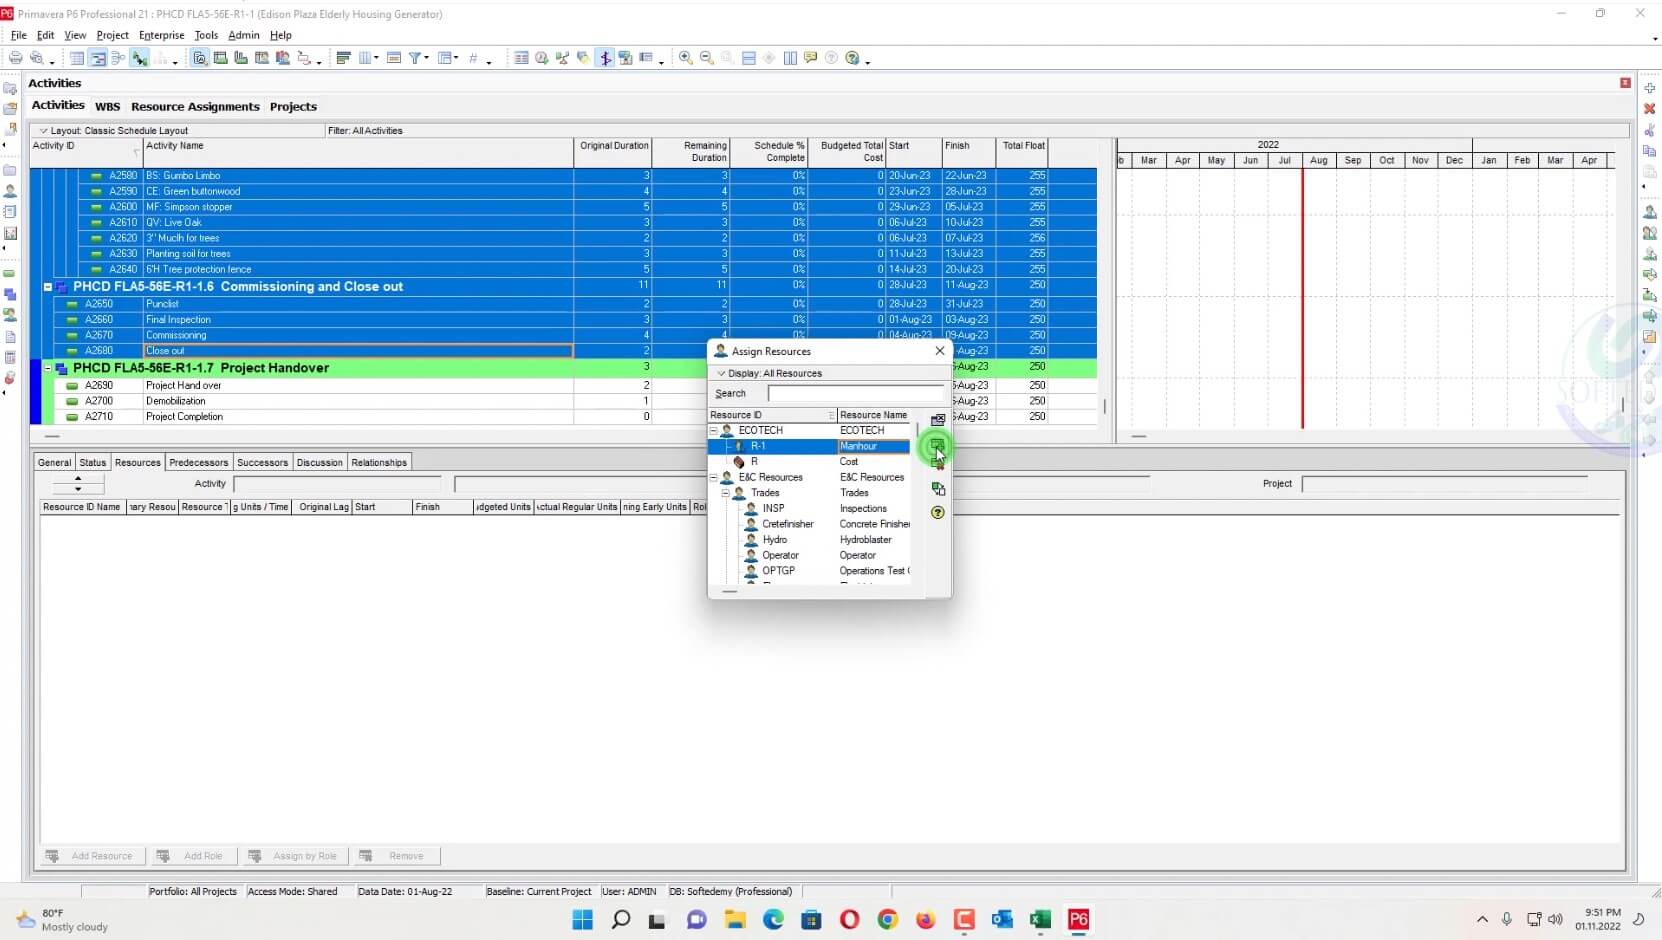
Assign the weights to the activities according to the sheet you created.
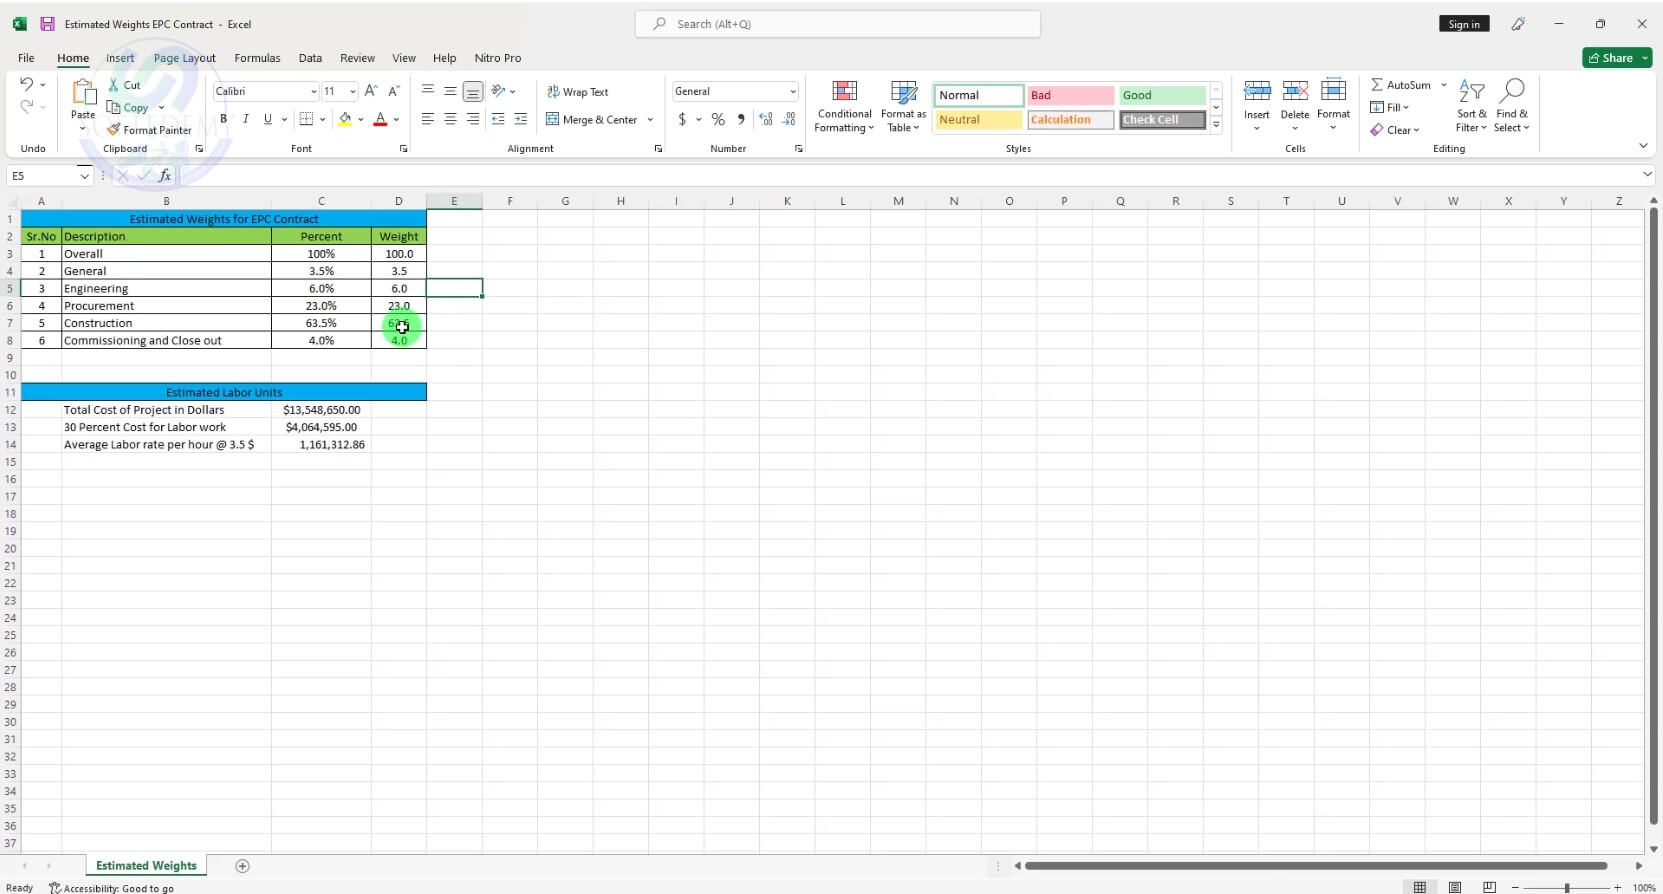
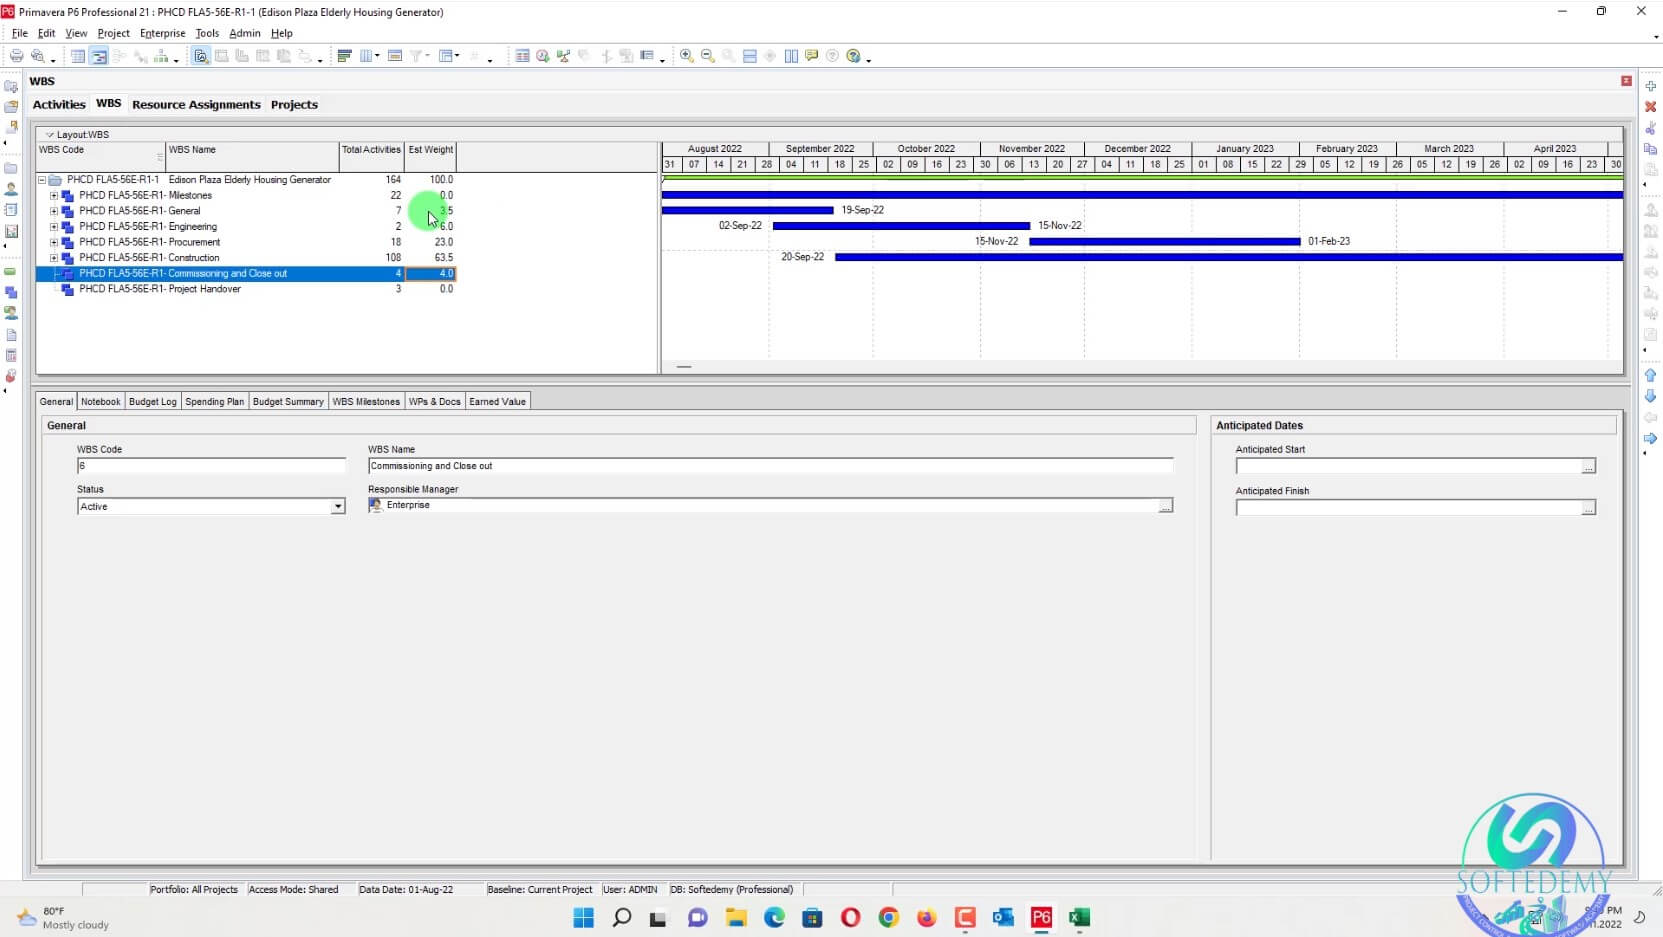
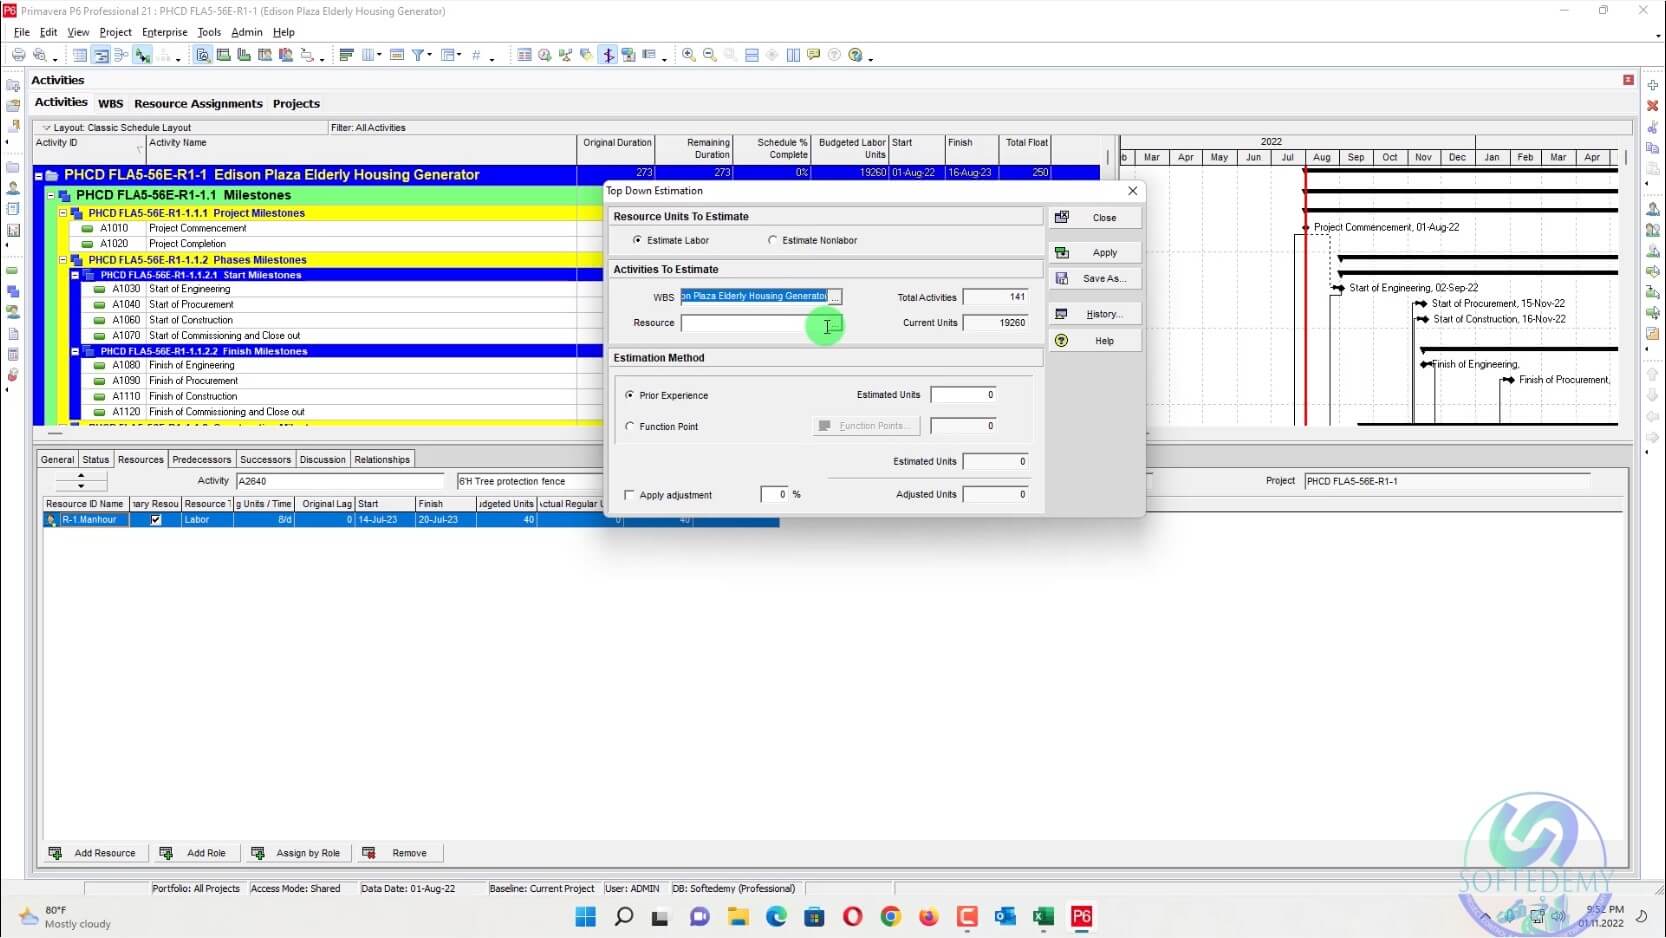
Go to the Resource Usage Profile
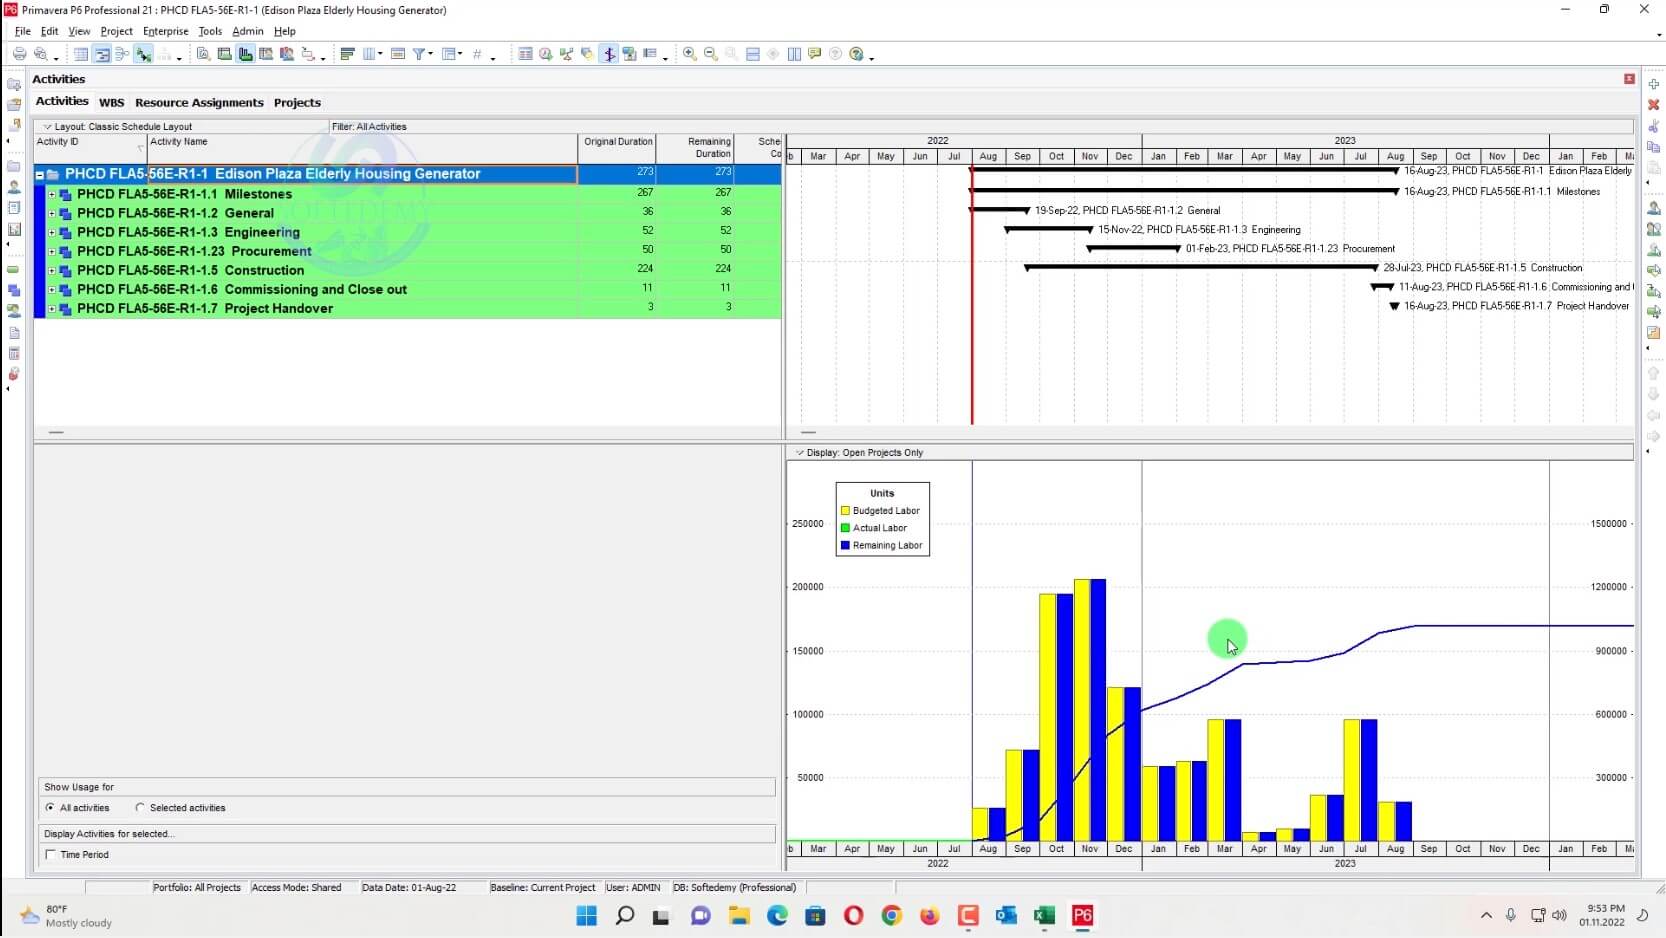
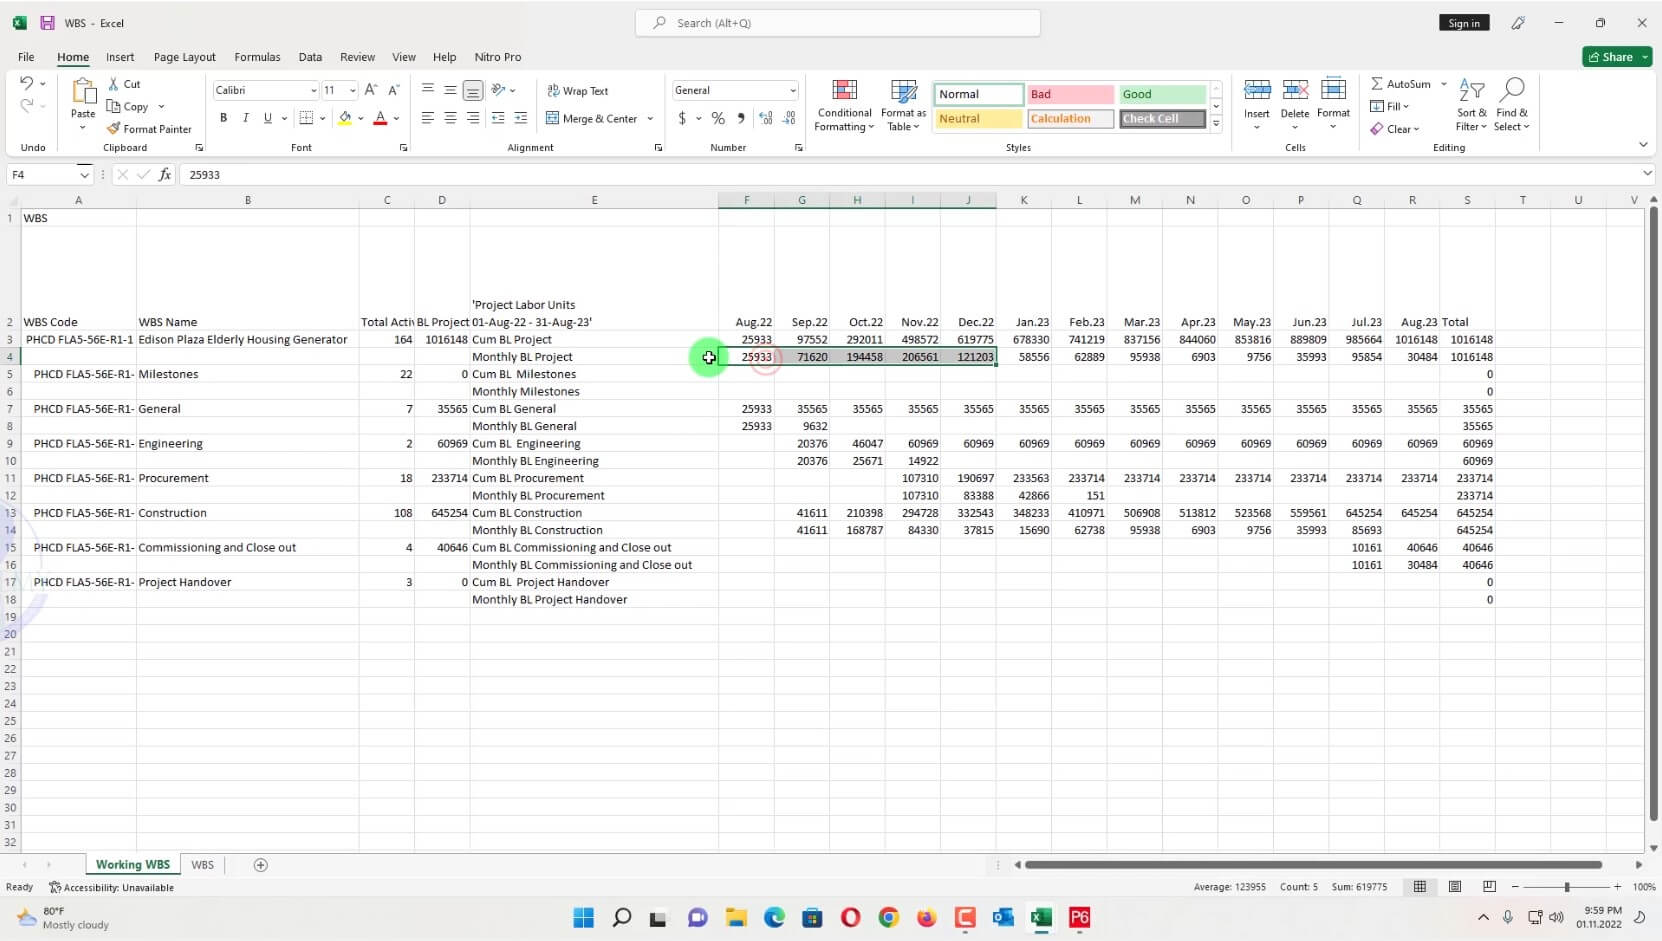
Export the data to Excel.
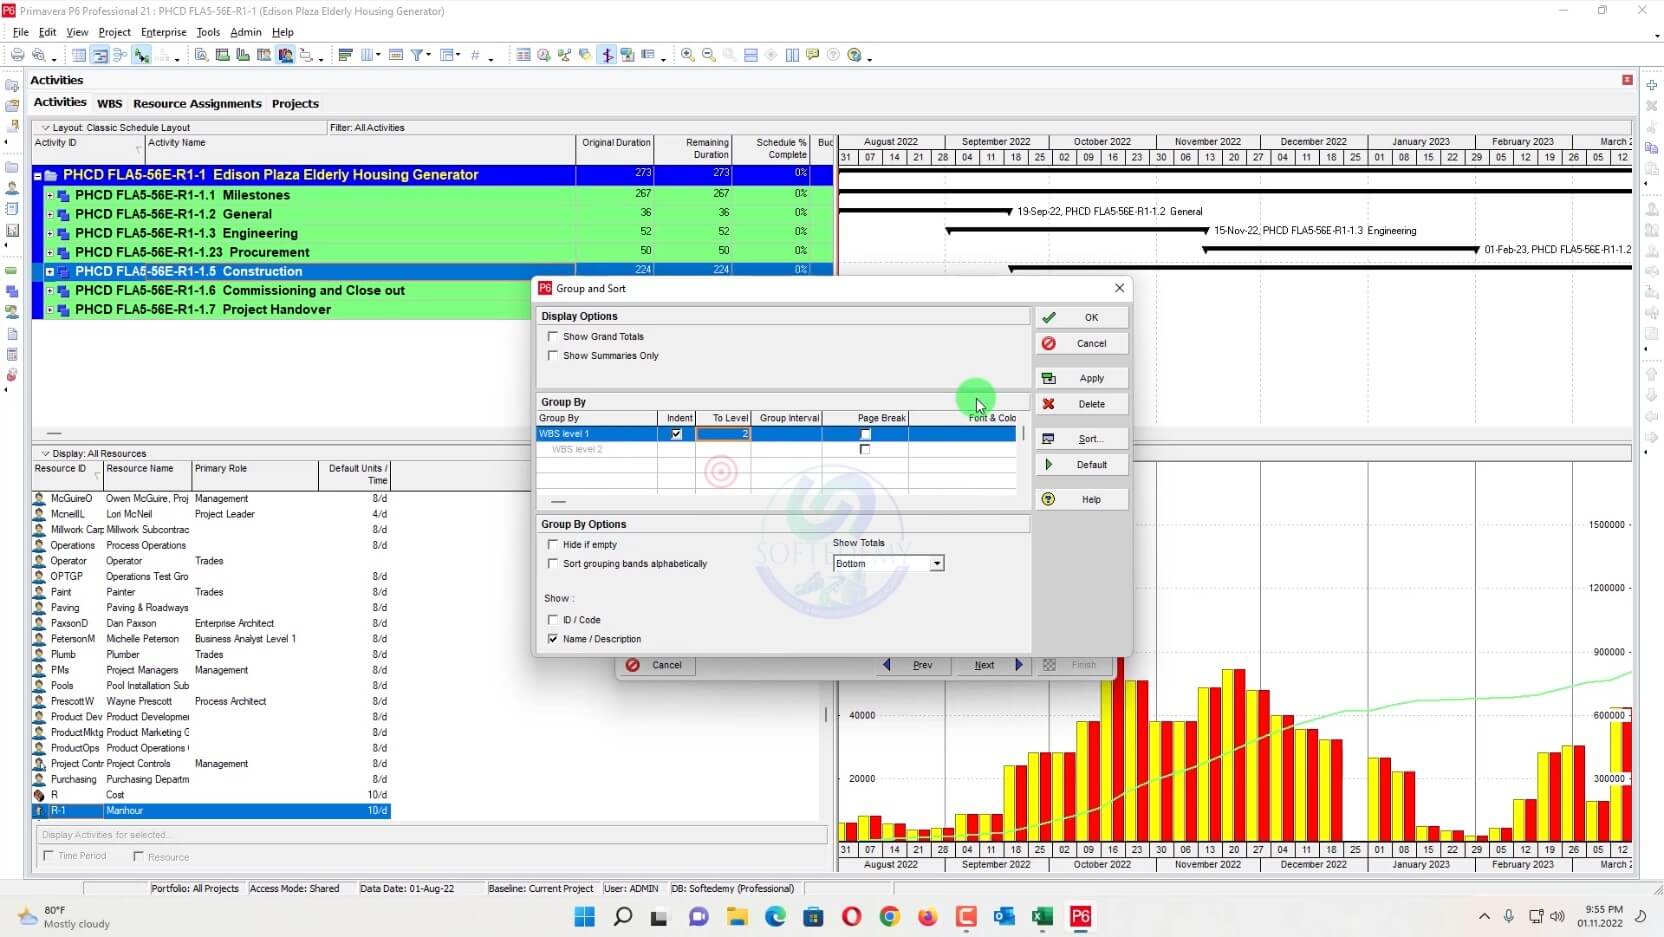
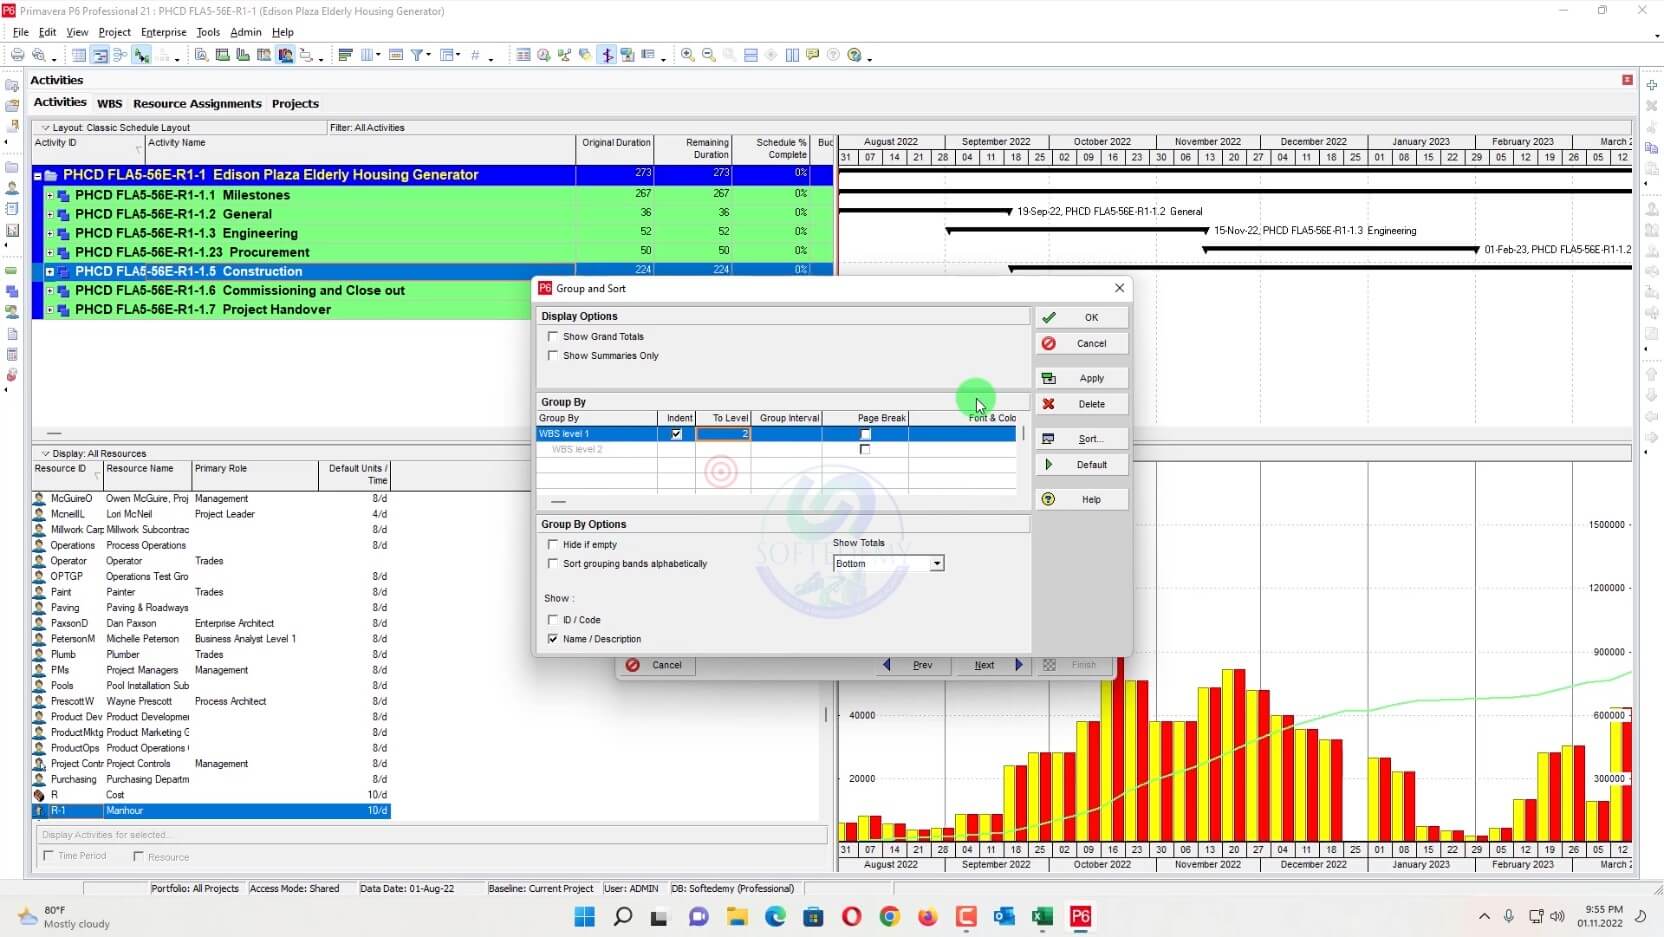
Group the activities by WBS and sort them by the start date..
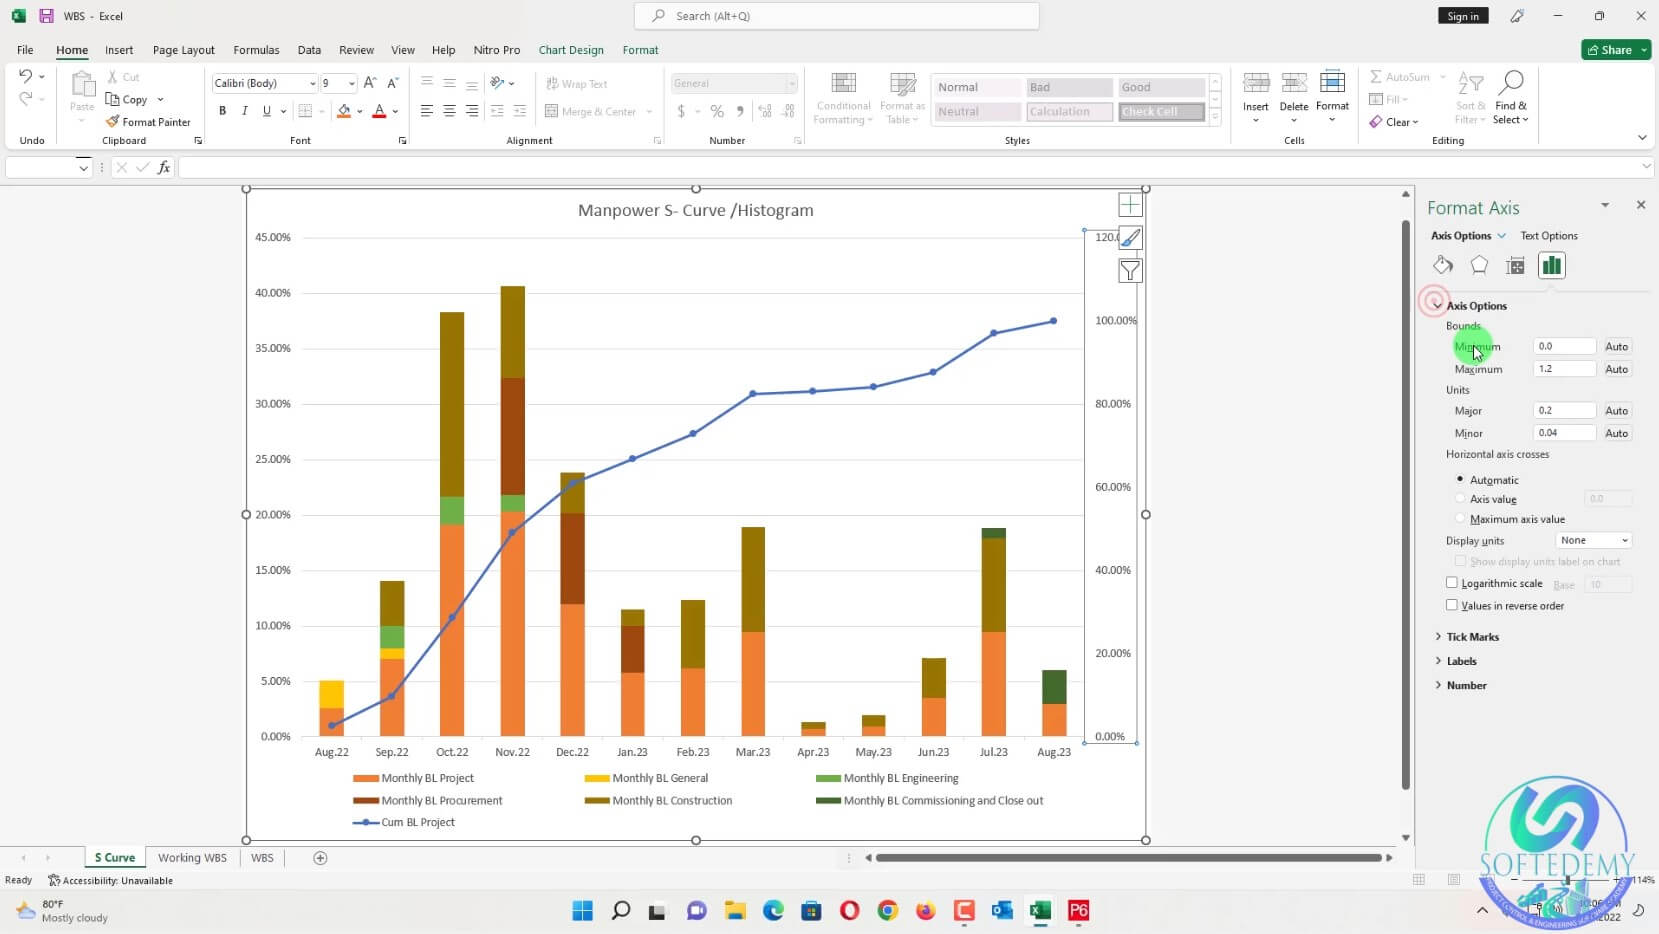
Open the Excel sheet and create an S-curve graph by selecting the data.
Format the graph as required.
Create S Curve Without Resources from Primavera P6 | By activity weightage calculation and Resources
Watch the below video to understood complete demonstration of the article.
Frequently Asked Questions:
What is an S-curve in project management?
An S-curve is a graphical representation of the cumulative work done over time. It helps to track the progress of a project by comparing the planned work with the actual work completed.
How can I create an S-curve without any resources in Primavera P6?
You can create an S-curve using activity weightage calculation. First, assign weights to each activity in your project according to their importance, and then group and sort the activities in the resource usage profile. Export the data to Excel and create an S-curve graph by selecting the data.
Can I create an S-curve based on duration?
No, it is not recommended to create an S-curve based on duration because the timeline lies on the x-axis. To create an S-curve, you need some value on the y-axis, such as cost, unit, or percent.
What are weightages in project management?
Weightages are values assigned to each activity in a project to indicate their relative importance. These values are usually expressed in percentage and are used to calculate the progress of the project.
How can I decide on weightages for my project?
You need to sit with your technical team and decide on the weightages based on the importance of each activity. The weightages may vary for different projects, depending on their scope, complexity, and duration.
How do we create an S-curve in Primavera P6 without any resources?
We can create an S-curve in Primavera P6 without any resources by using activity weightage calculation. We need to assign weights to the activities according to a specific sheet, and then we can create an S-curve or histogram.
What is the importance of weightages in creating an S-curve?
Weightages are essential in creating an S-curve because they help to allocate a percentage of progress to different activities or milestones. They help to monitor the progress of a project and compare it with the planned progress.
Can we customize the weightages according to our project needs?
Yes, we can customize the weightages according to our project needs. Weightages are different for different projects, and we need to sit with the technical team to decide on them. We can change the value according to our project requirements.
Is it possible to create an S-curve without available resources?
No, you need some value such as percent, unit, or cost to create an S-curve.
What is wrong with creating an S-curve on the basis of duration?
It is wrong to create an S-curve on the basis of duration because the timeline lies on the x-axis, and on the y-axis, you need some value such as percent, unit, or cost.
How can you create an S-curve without any resources, cost, or unit?
You can create an S-curve without any resources, cost, or unit by creating a sheet with weightages for each milestone or state and estimated labor units, and then assigning those weightages to the activities in Primavera P6.
How do you create an estimated labor unit for S-curve creation?
You can create an estimated labor unit for S-curve creation by taking the percentage of labor cost for the project and multiplying it by the total number of hours.
What are the steps to creating an S-curve in Primavera P6 and Excel?
The steps to creating an S-curve in Primavera P6 and Excel are: creating a project, adding activities and assigning resources, assigning weights to activities according to a weightage sheet, grouping and sorting activities, selecting the S-curve tab, selecting the unit of measure, recalculating and exporting data to Excel, and formatting the graph as required.
Why is it important to sit with the technical team to decide on weightages?
It is important to sit with the technical team to decide on weightages because they are different for different projects and need to be tailored to the specific project.
What are the benefits of using an S-curve in project management?
The benefits of using an S-curve in project management include visualizing project progress, identifying potential delays and issues, forecasting project completion, and communicating project status to stakeholders.
What is the importance of S-curves in tracking project progress?
S-curves are important in tracking project progress because they provide a visual representation of the planned and actual progress of a project, which can help project managers identify any deviations from the plan and take corrective actions.
What are weightages, and how are they set for a project?
Weightages are the percentage value assigned to each milestone or state of the project. The technical team needs to sit together and decide on them based on the project requirements.
How can you create estimated labor units?
You can calculate the labor hours and cost and assign a value to it.
What is the importance of an S-curve in project management?
S-curves help track project progress, identify potential issues, and make data-driven decisions.
What are some common mistakes to avoid when creating an S-curve in Primavera P6?
Incorrect weightages, not assigning resources to activities, and not grouping and sorting activities correctly.
What are the benefits of using an S-curve in project management?
S-curves help in project planning, tracking, and forecasting.
What are the limitations of creating an S-curve without any resources or units?
Without any resources or units, the S-curve will not have any meaningful data to track project progress.
What is the importance of sitting with the technical team to decide on weightages?
Weightages are different for different projects, and sitting with the technical team helps decide on the appropriate weightages for the project.
How can you format the S-curve graph as required?
You can format the graph by selecting the data and using the formatting options available in Excel.
What are the weightages for creating an S-curve in Primavera P6?
The weightages are different for different projects and need to be decided by the technical team.
How can you create an S-curve in Primavera P6 and Excel?
You can create an S-curve by assigning weightages to activities, grouping and sorting them, selecting the unit of measure, and exporting the data to Excel.
What is the difference in weightages for different projects?
Weightages are different for different projects based on their requirements and need to be decided by the technical team.
What is an S-curve, and how does it help in tracking project progress?
An S-curve is a graphical representation of the progress of a project over time. It helps in tracking project progress, identifying potential issues, and making data-driven decisions.
Conclusion
In conclusion, we hope that this tutorial has helped you to create an S-curve or histogram without any resources, cost, or unit. We have provided a step-by-step guide, and you can use the attached sheet to create an S-curve for your project. Remember that weightages are different for different projects, and you need to sit with the technical team to decide on them.
Leave a Reply
You must be logged in to post a comment.


