


Mastering Project Cost Control: Essential Formulas You Need to Know
Project cost control is a critical aspect of project management, ensuring that projects are completed within the budgeted costs. Understanding and applying key cost control formulas can make the difference between a project’s success and failure. Below, we explore 40 vital formulas that every project manager should have at their fingertips.
What is Project Cost Control?
Project cost control involves monitoring and managing the expenses of a project to adhere to the approved budget. It requires a thorough understanding of various financial principles and the ability to forecast and mitigate risks that could lead to budget overruns.
Key Formulas for Effective Cost Control
1. Total Project Cost (TPC)
Formula: TPC = Direct Costs (DC) + Indirect Costs (IC)
Application: This formula helps in calculating the entire cost of a project, combining both direct costs like labor and materials and indirect costs like overhead.
2. Direct Costs
Formula: Direct Costs = Labor Costs (LC) + Material Costs (MC) + Equipment Costs (EC)
Application: Direct costs are expenses directly tied to project production, essential for determining the base expenditure of a project.
3. Indirect Costs
Formula: Indirect Costs = Overhead Costs (OC) + General & Administrative Costs (G&A)
Application: These are the costs not directly linked to production but necessary for supporting the project environment.
4. Overhead Costs (OC)
Formula: OC = Utilities + Rent + Depreciation + Taxes
Application: Overhead costs cover the ongoing expenses of maintaining the project site and administrative offices.
5. General & Administrative Costs (G&A)
Formula: G&A = Salaries + Insurance + Office Supplies
Application: These costs account for the salaries and other expenses related to administrative staff.
6. Labor Costs (LC)
Formula: LC = Wage Rate x Hours Worked
Application: Essential for calculating the total cost of manpower, this formula multiplies the hourly wage by the number of hours worked.
7. Material Costs (MC)
Formula: MC = Quantity of Material x Unit Cost of Material
Application: This formula helps project managers estimate the cost of materials needed for the project.
8. Equipment Costs (EC)
Formula: EC = Depreciation + Maintenance + Operating Costs
Application: It covers the costs associated with using, maintaining, and depreciating project equipment.
Advanced Project Cost Control Metrics
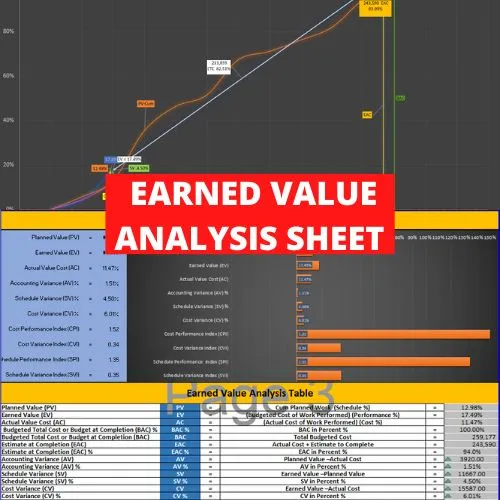
9. Earned Value (EV)
Formula: EV = % Complete x Budgeted Cost of Work Performed (BCWP)
Application: Earned value is a measure of the project’s progress against the planned budget, helping in performance measurement.
10. Cost Performance Index (CPI)
Formula: CPI = EV / AC
Application: This index is critical for measuring the cost efficiency of the project work performed.
11. Schedule Performance Index (SPI)
Formula: SPI = EV / PV
Application: SPI assesses the efficiency of project progress relative to the planned schedule.
Long-term Financial Planning Formulas
12. Net Present Value (NPV)
Formula: NPV = Sum of Present Values of Cash Inflows – Sum of Present Values of Cash Outflows
Application: NPV helps in decision making for project investments by comparing the value of money received in the future to an amount of money received today.
13. Internal Rate of Return (IRR)
Formula: IRR = Discount Rate at which NPV = 0
Application: IRR is used to evaluate the profitability of potential investments, determining the rate of return at which the present value of cash inflows equals the initial investment.
Detailed Cost Tracking Formulas
14. Actual Cost of Work Performed (ACWP)
Formula: ACWP = Actual Costs (AC)
Application: This metric is used to track the actual expenditures on project work performed to date, essential for monitoring budget adherence.
15. Budgeted Cost of Work Performed (BCWP)
Formula: BCWP = % Complete x Budget at Completion (BAC)
Application: Known as Earned Value, it measures the budgeted value of work actually performed, helping to gauge progress against the budget.
16. Cost Variance (CV)
Formula: CV = EV – AC
Application: Cost Variance provides a quick snapshot of budget health, indicating whether the project is over or under budget.
17. Schedule Variance (SV)
Formula: SV = EV – PV
Application: This formula helps project managers understand how far ahead or behind a project is in terms of the schedule.
Efficiency and Performance Indicators
18. To-Complete Performance Index (TCPI)
Formula: TCPI = (BAC – EV) / (BAC – AC)
Application: TCPI is a forward-looking metric that estimates the cost performance efficiency needed to complete the project within the remaining budget.
19. Estimate at Completion (EAC)
Formula: EAC = BAC / CPI or AC + (BAC – EV)
Application: EAC forecasts the expected total cost of the project at completion, considering current performance trends.
20. Variance at Completion (VAC)
Formula: VAC = BAC – EAC
Application: VAC predicts the expected budget surplus or deficit at the project’s end, offering insights into overall financial performance.
Investment Evaluation Formulas
21. Payback Period (PP)
Formula: PP = Initial Investment / Annual Cash Inflow
Application: This metric evaluates how long it will take for an investment to pay back its initial cost from cash inflows.
22. Discounted Payback Period (DPP)
Formula: DPP = Initial Investment / (Annual Cash Inflow x Discount Factor)
Application: DPP adjusts the payback period for the time value of money, providing a more accurate financial assessment.
23. Net Present Value (NPV)
Formula: NPV = Sum of Present Values of Cash Inflows – Sum of Present Values of Cash Outflows
Application: NPV helps in assessing the profitability of a project by comparing the present value of cash inflows and outflows over its lifespan.
24. Internal Rate of Return (IRR)
Formula: IRR = Discount Rate at which NPV = 0
Application: IRR is a critical indicator for evaluating the profitability of potential investments, indicating the return rate where the project breaks even.
Profitability and Safety Margins
25. Gross Profit Margin (GPM)
Formula: GPM = (Revenue – Cost of Goods Sold) / Revenue x 100
Application: This ratio shows the percentage of revenue that exceeds the cost of goods sold, a direct indicator of production efficiency.
26. Net Profit Margin (NPM)
Formula: NPM = Net Profit / Revenue x 100
Application: NPM provides insights into the overall profitability of a project, indicating how much of each dollar earned is profit.
27. Margin of Safety (MOS)
Formula: MOS = Current Sales – Break-even Sales
Application: MOS measures how much sales can drop before a project or business starts incurring losses, indicating financial safety.
Critical Formulas for Long-Term Financial Planning
28. Contribution Margin (CM)
Formula: CM = Revenue – Variable Costs
Application: This formula helps determine the profit margin that contributes to covering fixed costs and generating profit. It’s crucial for assessing the profitability of individual items or services and making pricing and production decisions.
29. Return on Investment (ROI)
Formula: ROI = (Net Profit / Cost of Investment) x 100
Application: ROI is a performance measure used to evaluate the efficiency of an investment or to compare the efficiencies of several different investments. It’s vital for determining the success of a project from a financial standpoint.
30. Cost of Capital (WACC)
Formula: WACC = (E/V * Re) + (D/V * Rd * (1 – Tax Rate))
Application: The Weighted Average Cost of Capital (WACC) is used to calculate a company’s cost of financing projects by blending the costs of equity and debt. Understanding WACC is essential for making investment decisions and for evaluating the economic feasibility of projects.
Forecasting and Risk Management Metrics
31. Cash Flow Formula
Formula: Cash Flow = Cash Inflows – Cash Outflows
Application: This straightforward formula is crucial for assessing the liquidity of a project at any given time. Proper cash flow management ensures that a project has enough liquidity to meet its obligations and avoid financing issues.
32. Working Capital Formula
Formula: Working Capital = Current Assets – Current Liabilities
Application: This metric assesses a project’s operational efficiency and short-term financial health. It’s vital for ensuring that a project can continue its operations and meet its obligations without needing additional funding or facing financial strain.
33. Break-Even Point (BEP)
Formula: BEP = Fixed Costs / (Selling Price per Unit – Variable Cost per Unit)
Application: This formula calculates the amount of production or the number of units that need to be sold to cover all costs associated with making the product. BEP is critical for project planning, pricing strategies, and financial forecasting.
Performance Evaluation Metrics
34. Margin of Safety (MOS)
Formula: MOS = Current Sales – Break-even Sales
Application: The Margin of Safety helps managers understand how much sales can fall before the project starts losing money. This is crucial for risk assessment and strategic planning, especially in volatile markets or industries.
35. Net Present Value (NPV)
Formula: NPV = Sum of Present Values of Cash Inflows – Sum of Present Values of Cash Outflows
Application: NPV is a comprehensive tool for assessing the profitability of a project by calculating the net present value of all cash flows over the life of the project. It’s essential for making informed project investment decisions.
36. Internal Rate of Return (IRR)
Formula: IRR = Discount Rate at which NPV = 0
Application: IRR is used to evaluate the attractiveness of a project or investment. Higher IRR rates indicate more profitable projects, guiding decision-making on whether to proceed with the project.
Efficiency and Profitability Metrics
37. Gross Profit Margin (GPM)
Formula: GPM = (Revenue – Cost of Goods Sold) / Revenue × 100
Application: This metric measures the percentage of revenue that exceeds the cost of goods sold, offering insights into the basic profitability of the products or services before administrative costs and other overheads are considered. It’s a fundamental indicator of a project’s financial health and production efficiency.
38. Net Profit Margin (NPM)
Formula: NPM = (Net Profit / Revenue) × 100
Application: Net Profit Margin is an indicator of how effectively a company is managing its overall expenses. It tells you what percentage of revenue is converted into profit after all expenses are deducted, providing a clear view of the operational success.
39. Return on Investment (ROI)
Formula: ROI = (Net Profit / Cost of Investment) × 100
Application: ROI measures the gain or loss generated on an investment relative to the amount of money invested. It is used to compare the efficiency of several different investments, helping project managers and stakeholders understand the value added by undertaking the project.
Risk Management and Decision Making Metrics
40. Contribution Margin (CM)
Formula: CM = Revenue – Variable Costs
Application: Contribution Margin assesses how much revenue is available to cover fixed costs and generate profits after variable costs are paid. This metric is crucial for break-even analysis and pricing strategies.
41. Margin of Safety (MOS)
Formula: MOS = (Current Sales – Break-even Sales) / Current Sales × 100
Application: The Margin of Safety indicates how much sales can fall before a project or business reaches its break-even point. It is essential for assessing the risk level of failing to cover all costs and helps in making informed operational decisions.
42. Break-Even Point (BEP)
Formula: BEP = Fixed Costs / (Selling Price per Unit – Variable Cost per Unit)
Application: This formula calculates the point at which total costs and total revenue are equal, i.e., there is no profit or loss. BEP analysis is vital for determining the minimum output that must be exceeded for a project to become profitable.
Cash Flow and Capital Management
43. Cash Flow Formula
Formula: Cash Flow = Cash Inflows – Cash Outflows
Application: Managing cash flow is crucial for maintaining the liquidity needed to finance day-to-day operations and avoid financial distress. This formula helps track the net amount of cash and cash equivalents moving in and out of a project or business.
44. Working Capital Formula
Formula: Working Capital = Current Assets – Current Liabilities
Application: This metric measures a company’s operational efficiency and short-term financial health. Positive working capital indicates that the company has enough short-term assets to cover its short-term liabilities.
Investment Evaluation Metrics
45. Net Present Value (NPV)
Formula: NPV = Sum of Present Values of Future Cash Flows – Initial Investment
Application: NPV is used to analyze the profitability of a projected investment or project by calculating the difference between the present value of cash inflows and outflows over a period of time.
46. Internal Rate of Return (IRR)
Formula: IRR is the discount rate that makes the NPV of all cash flows from a particular project equal to zero.
Application: IRR is used to evaluate the attractiveness of a project or investment. The higher the IRR, the more desirable the project is likely to be.
Financial Performance Indicators
47. Discounted Payback Period (DPP)
Formula: DPP = Number of Years Before Full Recovery + (Unrecovered Cost at Start of Year / Cash Flow During Year)
Application: This metric refines the traditional payback period by considering the time value of money, thus providing a more accurate measure of how long it will take to recover the initial investment in present value terms.
48. Cost of Capital (WACC)
Formula: WACC = (E/V × Re) + ((D/V × Rd) × (1 − T))
Application: The Weighted Average Cost of Capital (WACC) is crucial for determining a company’s cost of financing its operations, which in turn helps in evaluating investment opportunities. It’s particularly important in decisions where project financing involves a mix of debt and equity.
Capital Budgeting Metrics
49. Total Cost of Ownership (TCO)
Formula: TCO = Initial Acquisition Cost + Operational Costs + Maintenance Costs + Decommissioning/Disposal Costs
Application: TCO is used to calculate the total economic value of an investment. This includes all costs associated with the acquisition, operation, maintenance, and eventual disposal of an asset. It’s vital for assessing the long-term cost implications of acquiring new technology or equipment.
50. Economic Value Added (EVA)
Formula: EVA = NOPAT – (Capital Invested × WACC)
Application: Economic Value Added is a measure of a company’s financial performance based on the residual wealth calculated by deducting its cost of capital from its operating profit. This formula helps determine the value created in excess of the required return on capital and is useful in assessing the true economic profit of a project.
Sustainability and Growth Metrics
51. Sustainable Growth Rate (SGR)
Formula: SGR = ROE × (1 – Dividend Payout Ratio)
Application: This rate defines how quickly a company or project can grow its revenues using internally generated resources without having to finance growth through external borrowing or equity. It’s essential for long-term planning and for maintaining healthy financial ratios without over-leveraging.
52. Capital Expenditure (CapEx) Forecasting
Formula: CapEx = Depreciated Value of Current Assets + Planned Investment – Resale Value
Application: This formula helps in budgeting for future investments in capital assets, crucial for maintaining and expanding operational capacity. It allows for effective allocation of financial resources towards growth initiatives and infrastructure development.
Risk and Return Metrics
53. Risk-Adjusted Return on Capital (RAROC)
Formula: RAROC = (Expected Return on Capital – Economic Capital Allocation × Risk Charge) / Economic Capital Allocation
Application: RAROC is used to assess the return on an investment considering the risk involved. It enables companies to ensure that the return compensates adequately for the risk, promoting risk management and financial health.
54. Probability of Default (PD)
Formula: PD = Number of Defaults / Number of Total Obligations
Application: This metric measures the likelihood of a borrower failing to make required payments. It’s particularly useful in project finance to assess credit risk and to ensure that financial models and forecasts include adequate risk contingencies.
Advanced Forecasting Techniques
55. Forecast Final Cost (FFC)
Formula: FFC = Actual Costs to Date + Estimated Cost to Complete
Application: This metric is used to project the total cost of a project at completion, integrating actual expenditures with forecasted future costs. It is essential for adjusting budget allocations and ensuring that projects do not exceed financial boundaries.
56. Percentage of Completion (POC) Method
Formula: POC = (Costs Incurred to Date / Total Estimated Costs) × 100
Application: This accounting method recognizes revenue and expenses related to long-term projects as a percentage of work completed. It is vital for reflecting the financial status of a project more accurately throughout its life cycle.
Efficiency and Optimization Metrics
57. Activity-Based Costing (ABC)
Formula: Total Cost of Activity = Sum of (Resource Cost Rate × Amount of Resource Used)
Application: ABC is used to allocate costs to activities based on their use of resources, providing detailed insights into the most and least cost-intensive activities. This information helps optimize resource allocation and eliminate wasteful expenditures.
58. Cost-Benefit Analysis (CBA)
Formula: Net Benefit = Total Benefits – Total Costs
Application: CBA is used to evaluate the total expected cost versus the benefits to determine the feasibility of a project. It is crucial for strategic planning and helps stakeholders understand the tangible and intangible returns on their investments.
Risk Assessment and Mitigation Metrics
59. Value at Risk (VaR)
Formula: VaR = Z-Score × Standard Deviation of Portfolio Returns
Application: VaR is a statistical technique used to measure the level of financial risk within a firm or investment portfolio over a specific time frame. This metric helps in assessing the potential for loss in investments and in designing more effective risk management strategies.
60. Monte Carlo Simulation
Formula: Based on repeated random sampling to compute results
Application: This technique uses probability modeling to predict potential outcomes in a project, providing a comprehensive risk assessment and helping managers make informed decisions under uncertainty.
Sustainability and Long-Term Viability Metrics
61. Life Cycle Cost Analysis (LCCA)
Formula: LCCA = Initial Costs + Replacement Costs + Maintenance Costs + Operation Costs – Salvage Value
Application: LCCA is crucial for assessing the total cost of a project from inception to disposal. It aids in making decisions that encompass long-term cost efficiencies, sustainability practices, and the total expenditure over an asset’s lifetime.
62. Triple Bottom Line (TBL)
Formula: TBL = Social Value + Environmental Value + Economic Value
Application: TBL is a framework that goes beyond the traditional measures of profits, ROI, and shareholder value to include environmental and social dimensions. It’s essential for projects committed to sustainability and responsible governance.
Enhanced Financial Planning and Analysis Metrics
63. Return on Capital Employed (ROCE)
Formula: ROCE = (Earnings Before Interest and Taxes (EBIT) / Capital Employed) × 100
Application: ROCE is a profitability ratio that measures the efficiency and profitability of a company’s capital investments. It is crucial for determining how well a company is generating profits from its capital and is particularly useful in making cross-industry profitability comparisons.
64. Liquidity Ratios (Current Ratio and Quick Ratio)
Formula: Current Ratio = Current Assets / Current Liabilities; Quick Ratio = (Current Assets – Inventories) / Current Liabilities
Application: These ratios assess a project’s or a company’s ability to meet short-term obligations. The current ratio considers all current assets, while the quick ratio provides insight into a company’s ability to meet short-term obligations without relying on the sale of inventory.
Project Performance and Profitability Metrics
65. Debt Service Coverage Ratio (DSCR)
Formula: DSCR = Net Operating Income / Total Debt Service
Application: This metric is used to evaluate a company’s ability to produce enough cash to cover its debt payments. It is a critical factor in securing project financing, ensuring that the project generates sufficient cash flow to support debt servicing.
66. Operating Margin Ratio
Formula: Operating Margin = (Operating Income / Revenue) × 100
Application: This profitability metric measures the proportion of revenue left over after paying for variable production costs, such as wages and raw materials. It helps assess the efficiency of a project’s management by analyzing its ability to turn sales into pre-tax profits.
Risk Management and Control Metrics
67. Risk Exposure Index
Formula: Risk Exposure = Probability of Risk Occurrence × Impact of Risk
Application: This index quantifies the level of risk in terms of its likelihood and potential impact, helping managers prioritize risk mitigation strategies based on the severity of risk exposure.
68. Financial Leverage Ratios
Formula: Degree of Financial Leverage = % Change in EPS / % Change in EBIT
Application: This ratio measures the sensitivity of the company’s earnings per share (EPS) to fluctuations in operating income, indicating the extent to which a company is using debt to finance its assets.
Sustainability and Efficiency Metrics
69. Resource Utilization Rates
Formula: Resource Utilization Rate = (Total Hours Worked / Total Hours Available) × 100
Application: This metric assesses the efficiency with which resources are used within a project, ensuring optimal allocation and utilization of personnel and equipment, which is crucial for maintaining budget control and project efficiency.
70. Carbon Footprint Assessment
Formula: Carbon Footprint = Total Greenhouse Gas Emissions / Total Project Output
Application: This environmental metric helps projects assess their impact on the environment in terms of greenhouse gas emissions. It is vital for projects aiming to meet sustainability goals and reduce environmental impact.
Advanced Decision-Making Metrics
71. Incremental Benefit-Cost Ratio (IBCR)
Formula: IBCR = Incremental Benefits / Incremental Costs
Application: This metric is used to evaluate the profitability of an additional investment or project extension. It assists decision-makers in assessing whether the additional benefits derived from investing more into a project outweigh the additional costs incurred.
72. Profitability Index (PI)
Formula: PI = Present Value of Future Cash Flows / Initial Investment
Application: The Profitability Index is a tool that helps prioritize projects by calculating the relative profitability of potential investments. A PI greater than 1 indicates that the PV of returns exceeds the initial investment costs, making it a viable project.
Efficiency and Operational Metrics
73. Operating Cycle Analysis
Formula: Operating Cycle = Days Inventory Outstanding + Days Sales Outstanding – Days Payable Outstanding
Application: This formula measures the time it takes for a company to turn its inventory and accounts receivable into cash, minus the time it benefits from trade credits. It’s crucial for understanding cash flow timing in project operations.
74. Economic Order Quantity (EOQ)
Formula: EOQ = √(2DS / H)
Where: D is the demand rate, S is the order cost, and H is the holding cost per unit per year.
Application: EOQ is used in inventory management to determine the optimal order quantity that minimizes the total cost of inventory, including holding costs and reorder costs. This metric is vital for projects that require management of large amounts of inventory efficiently.
Risk and Uncertainty Metrics
75. Expected Monetary Value (EMV)
Formula: EMV = (Probability of Outcome 1 × Value of Outcome 1) + (Probability of Outcome 2 × Value of Outcome 2) + …
Application: EMV is used in risk management to calculate the average outcome when the future includes scenarios that may or may not happen. This metric helps project managers in making decisions under conditions of uncertainty.
76. Contingency Budgeting
Formula: Contingency Budget = (Estimated Cost × Contingency Percentage)
Application: This approach involves setting aside funds to cover unforeseen costs associated with risks in project execution. It is crucial for managing unexpected expenses without jeopardizing the project budget.
Sustainability and Ethical Performance Metrics
77. Social Return on Investment (SROI)
Formula: SROI = (Social Impact Value – Initial Investment) / Initial Investment
Application: This metric measures the extra-social value created by a project relative to the investment made into it. SROI is particularly useful for projects with significant social or environmental components, helping stakeholders understand the non-financial impacts of their investments.
78. Green Ratio
Formula: Green Ratio = (Total Green Practices Score / Total Number of Practices) × 100
Application: This environmental performance metric evaluates how well a project or company performs in terms of sustainable practices, encouraging environmentally friendly decisions in project management.
Leave a Reply
You must be logged in to post a comment.